With rates averaging 50 basis points lower than last year, sales are up 2.5% year-to-date.

We forecast the state needs to double the rate of construction to meet housing needs by 2029.

The market has slowed, but not for everyone. Correctly priced homes still go under contract in about a week. The slowdown is concentrated in mispriced listings.

Indiana sellers see 5.4% annual appreciation in Q1 2026
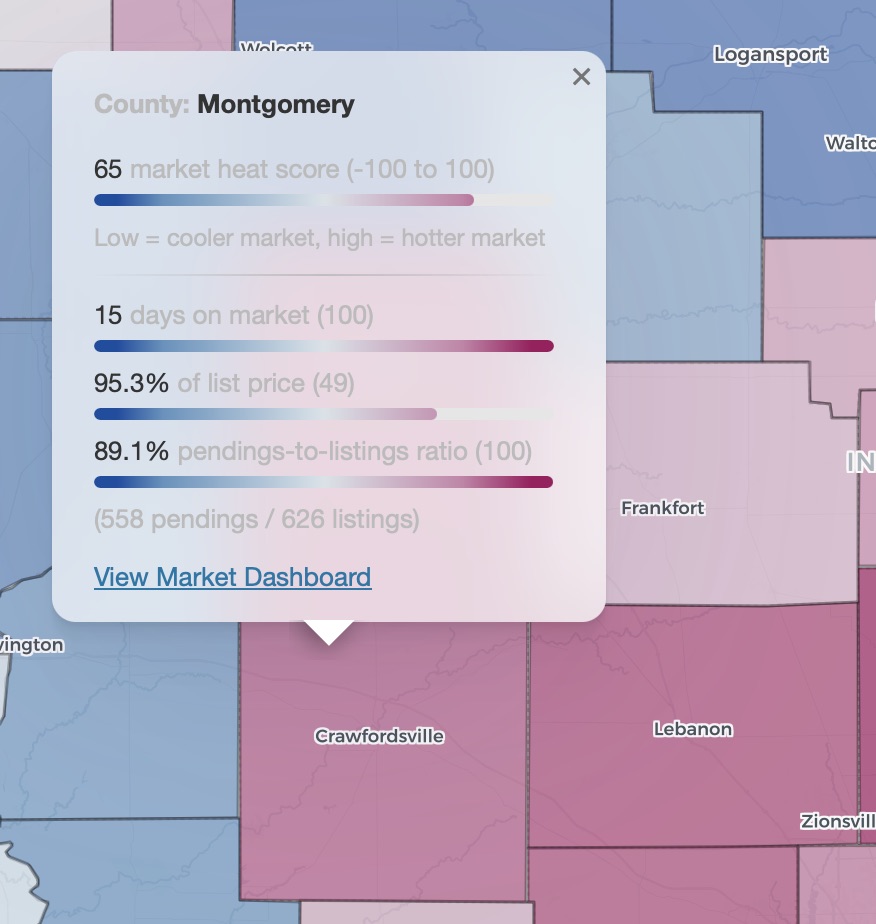
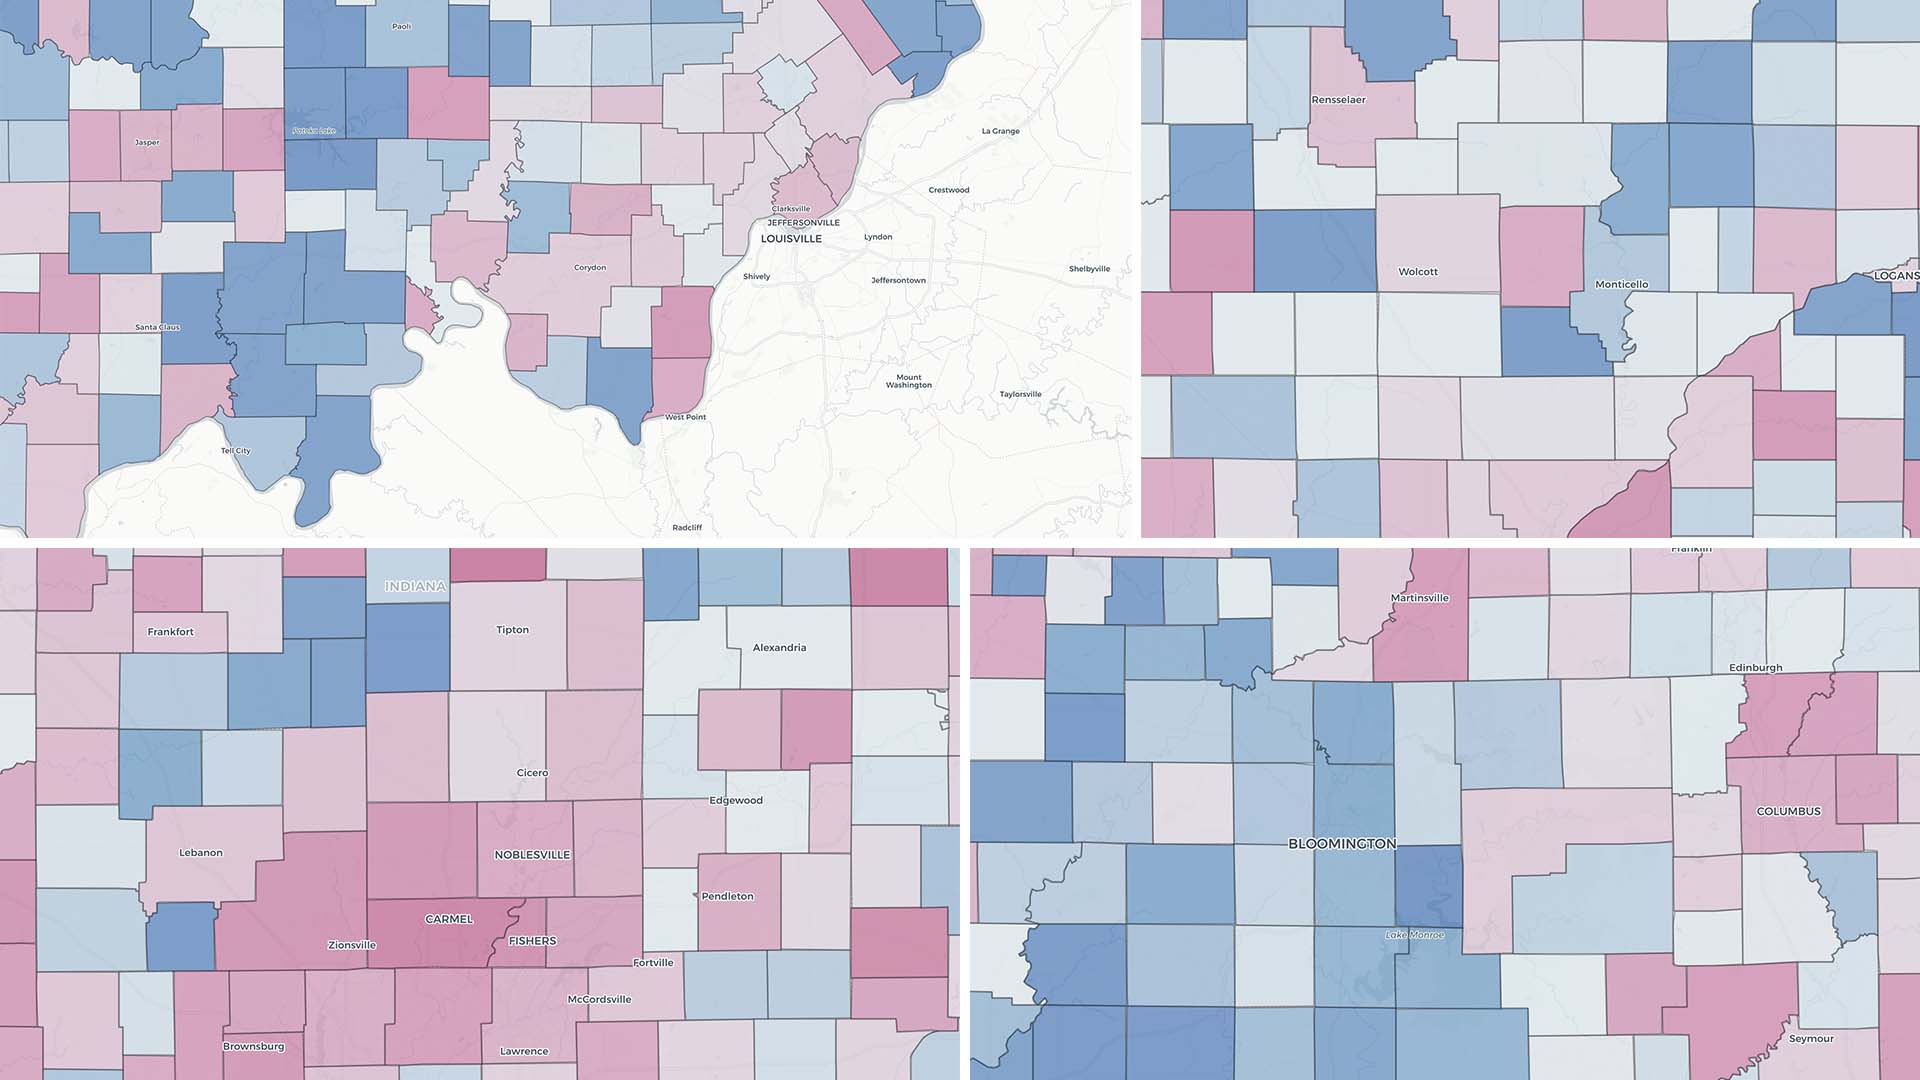
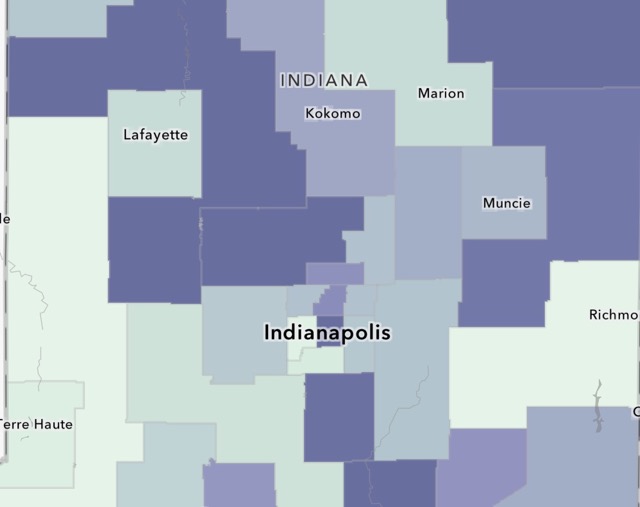
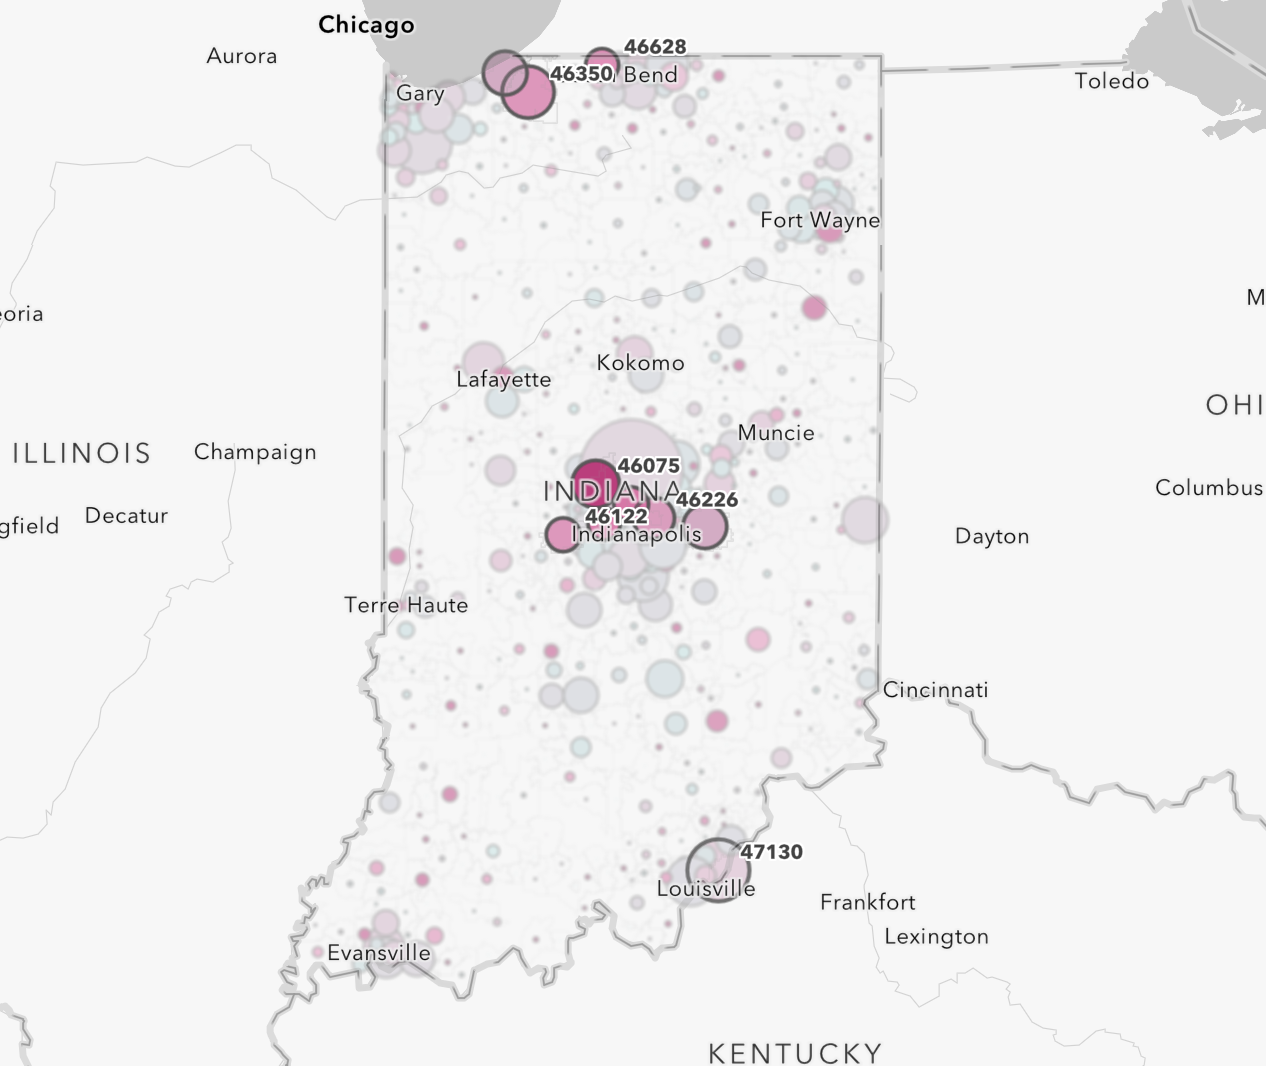
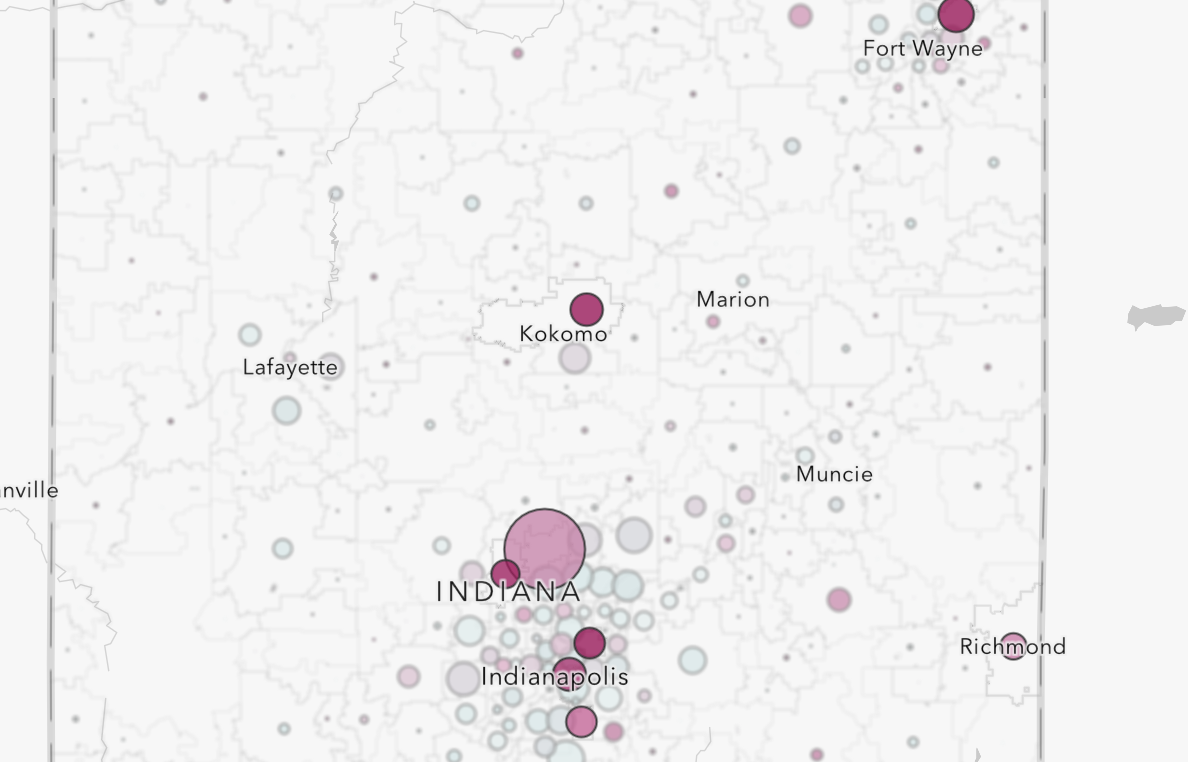
The new Market Heat Index maps demand pressure across every county in the state, combining days on market, list price performance, and pending contract activity into a single score. Explore the map to see where conditions are heating up and where they're easing off.
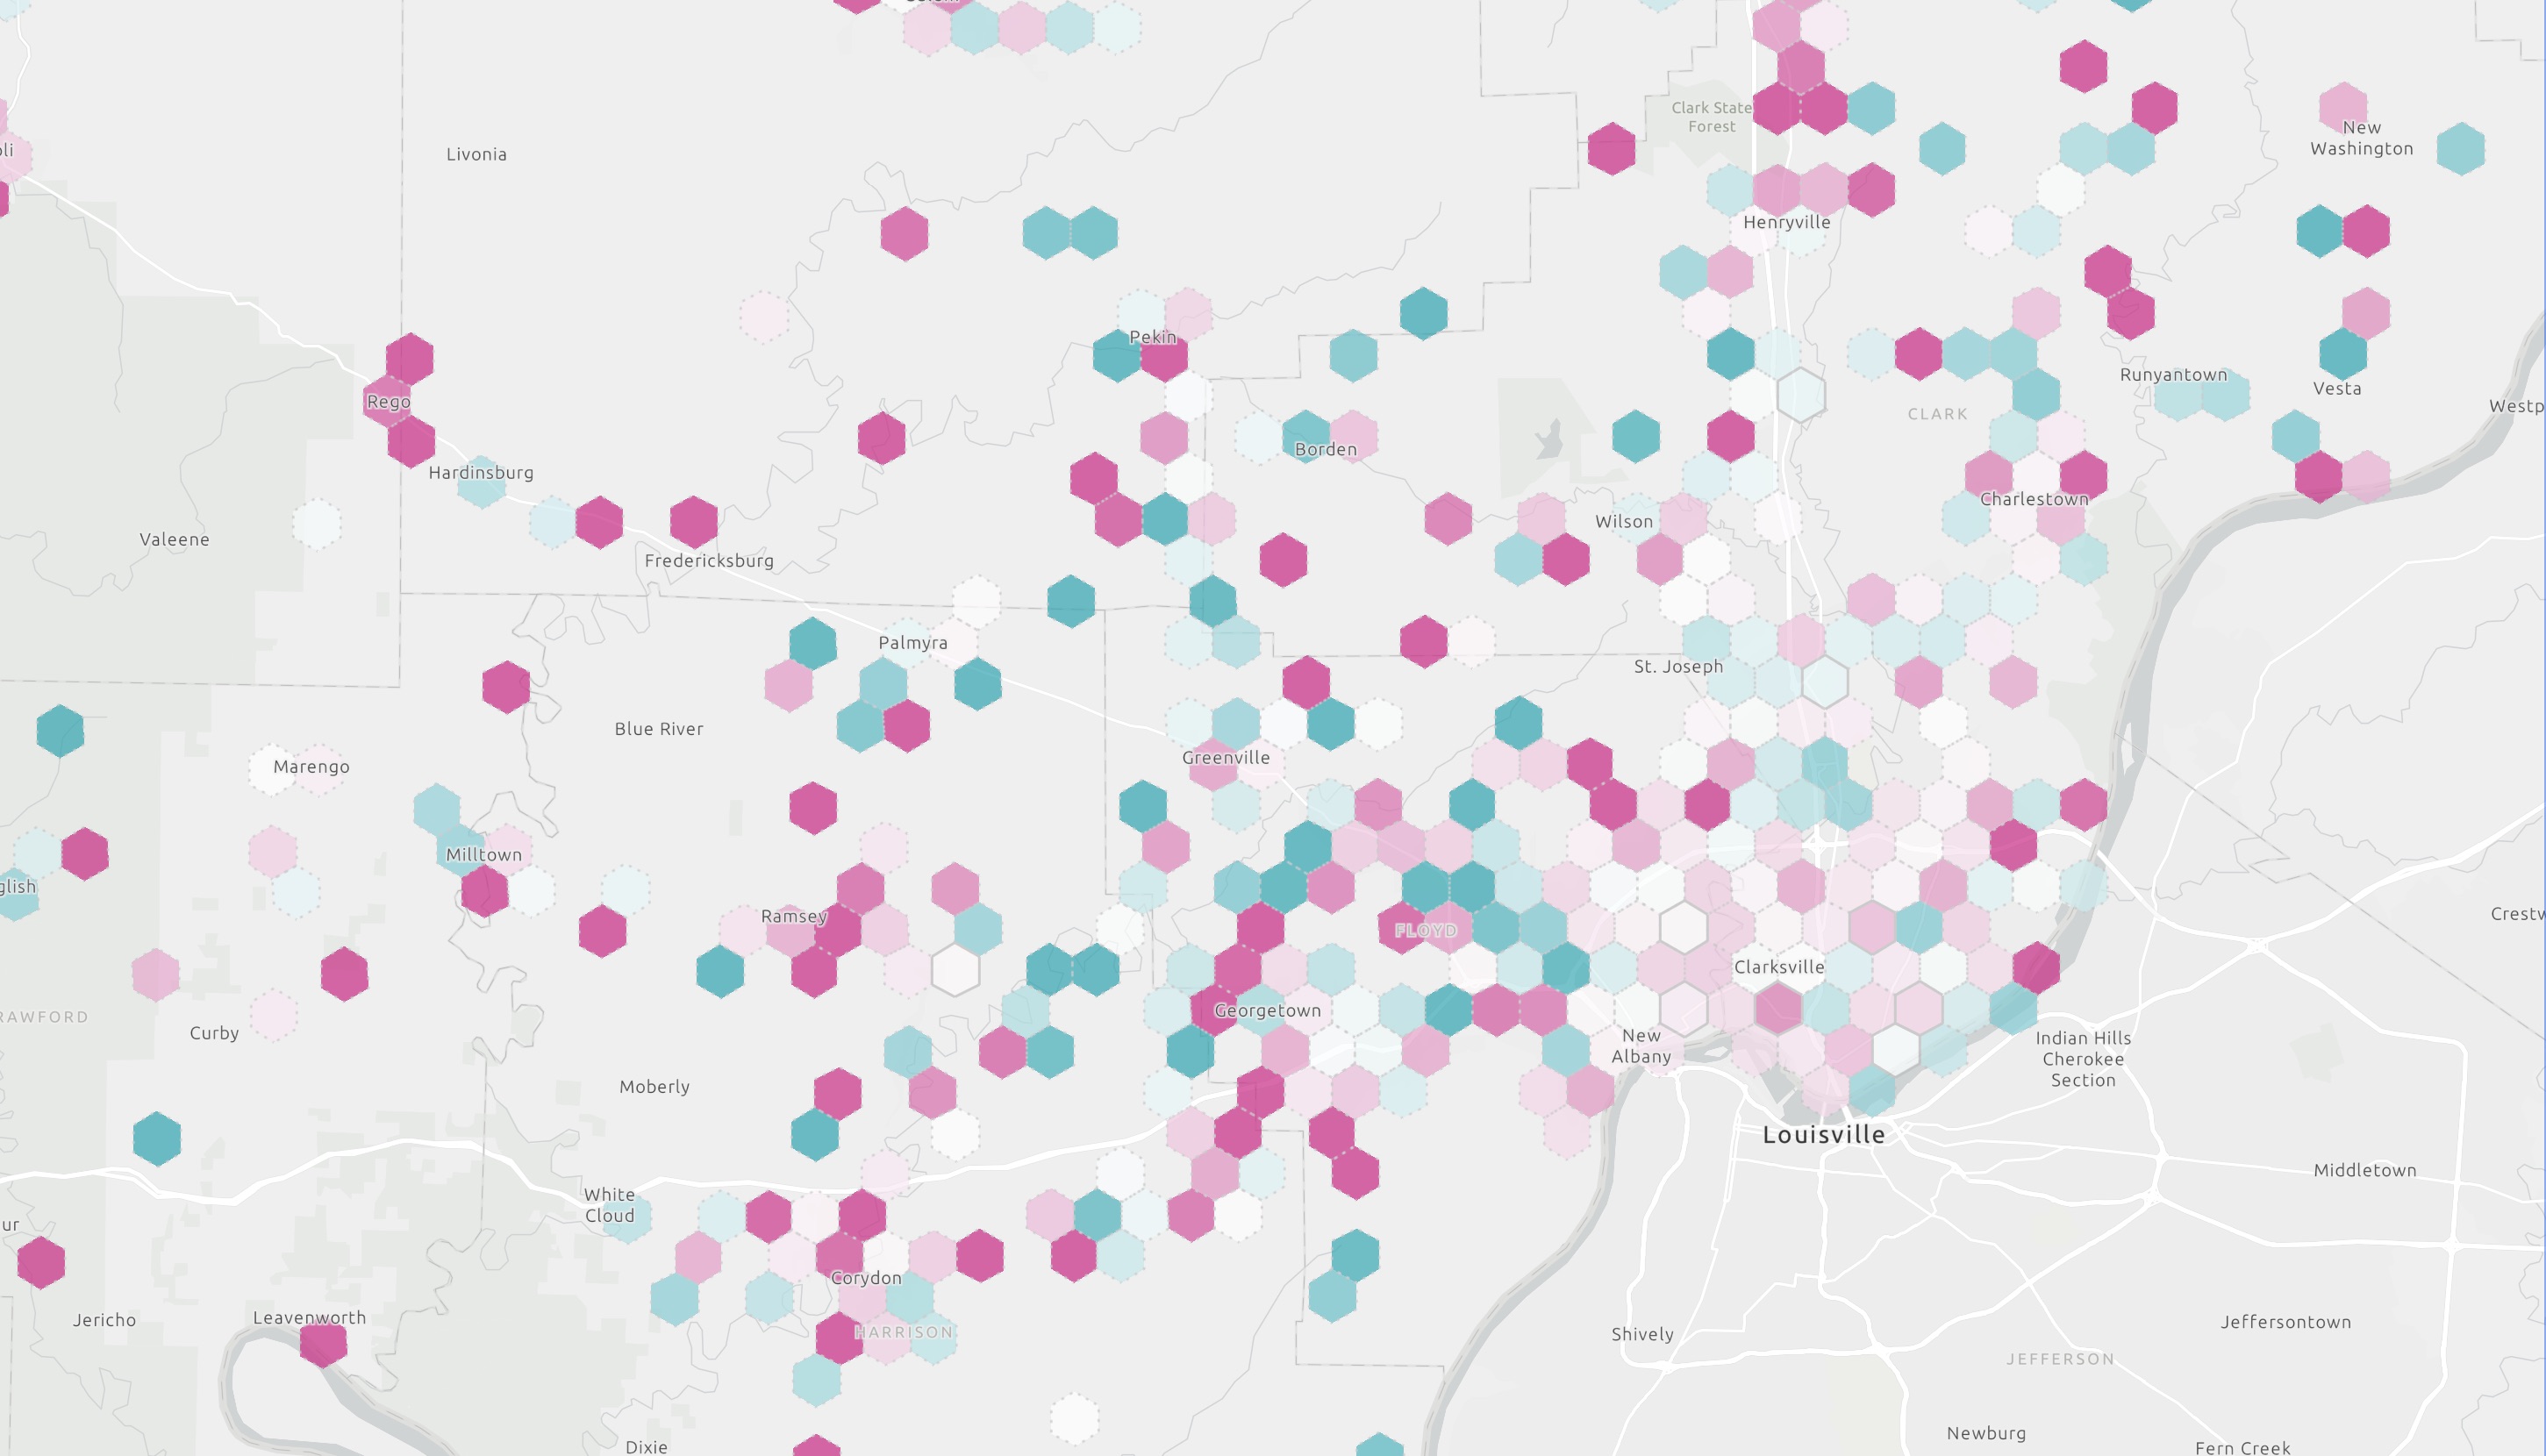
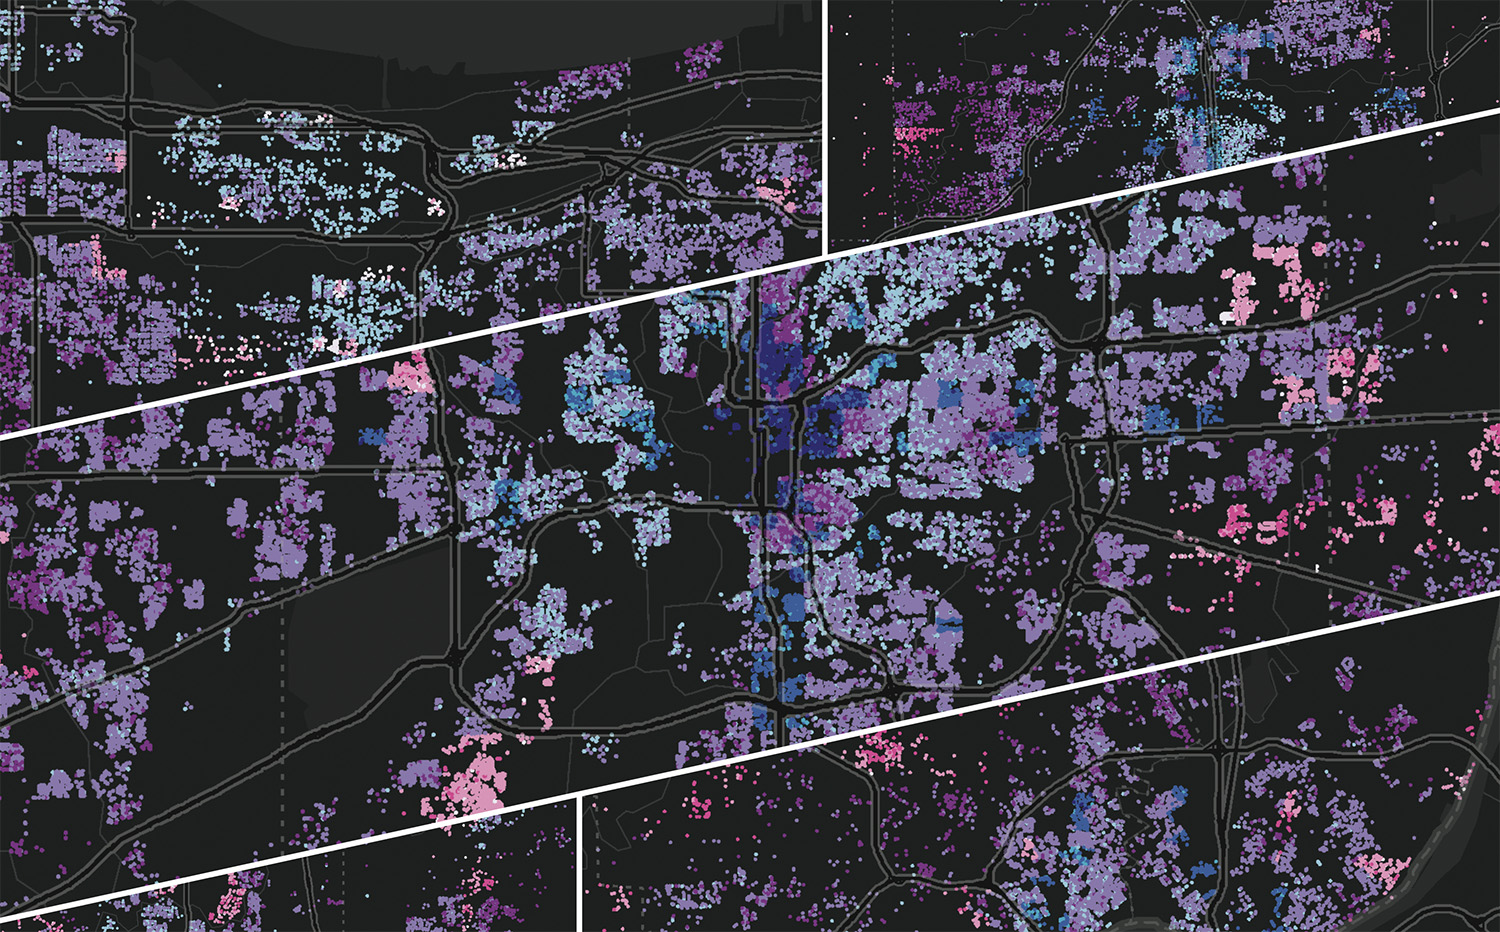
This map breaks the market down to half-mile hexagons, showing where prices rose, where they fell, and how much each neighborhood changed in 2025.

Sales were up 2% in 2025, and we forecast sales to rise by 3% in 2026 driven by an interest rate forecast of 6.2%.
We expect rates to average 6.2% and sales to grow by 3%.
Monday Map, December 8, 2025

Monday Map, November 24, 2025
112,000 Hoosier households bought homes in 2023 — more than five percent of all homeowners, a higher rate than in neighboring states. We uncover insights about homebuyers and likely first-time buyers.
What is the median monthly mortgage payment in your market, and how does it compare to incomes?

We're six months in. Here's where the market stands and how it's changed since last year.

Roughly 40% of Indiana home listings are affordable to households earning $75,000 - nearly double the national rate.
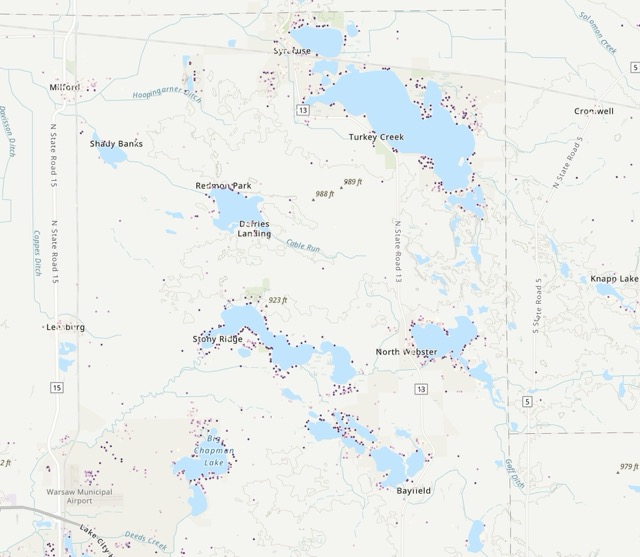 We analyzed 10,000 home sales and found that lakes have the strongest effect on prices, followed by streams, parks, and trails.
 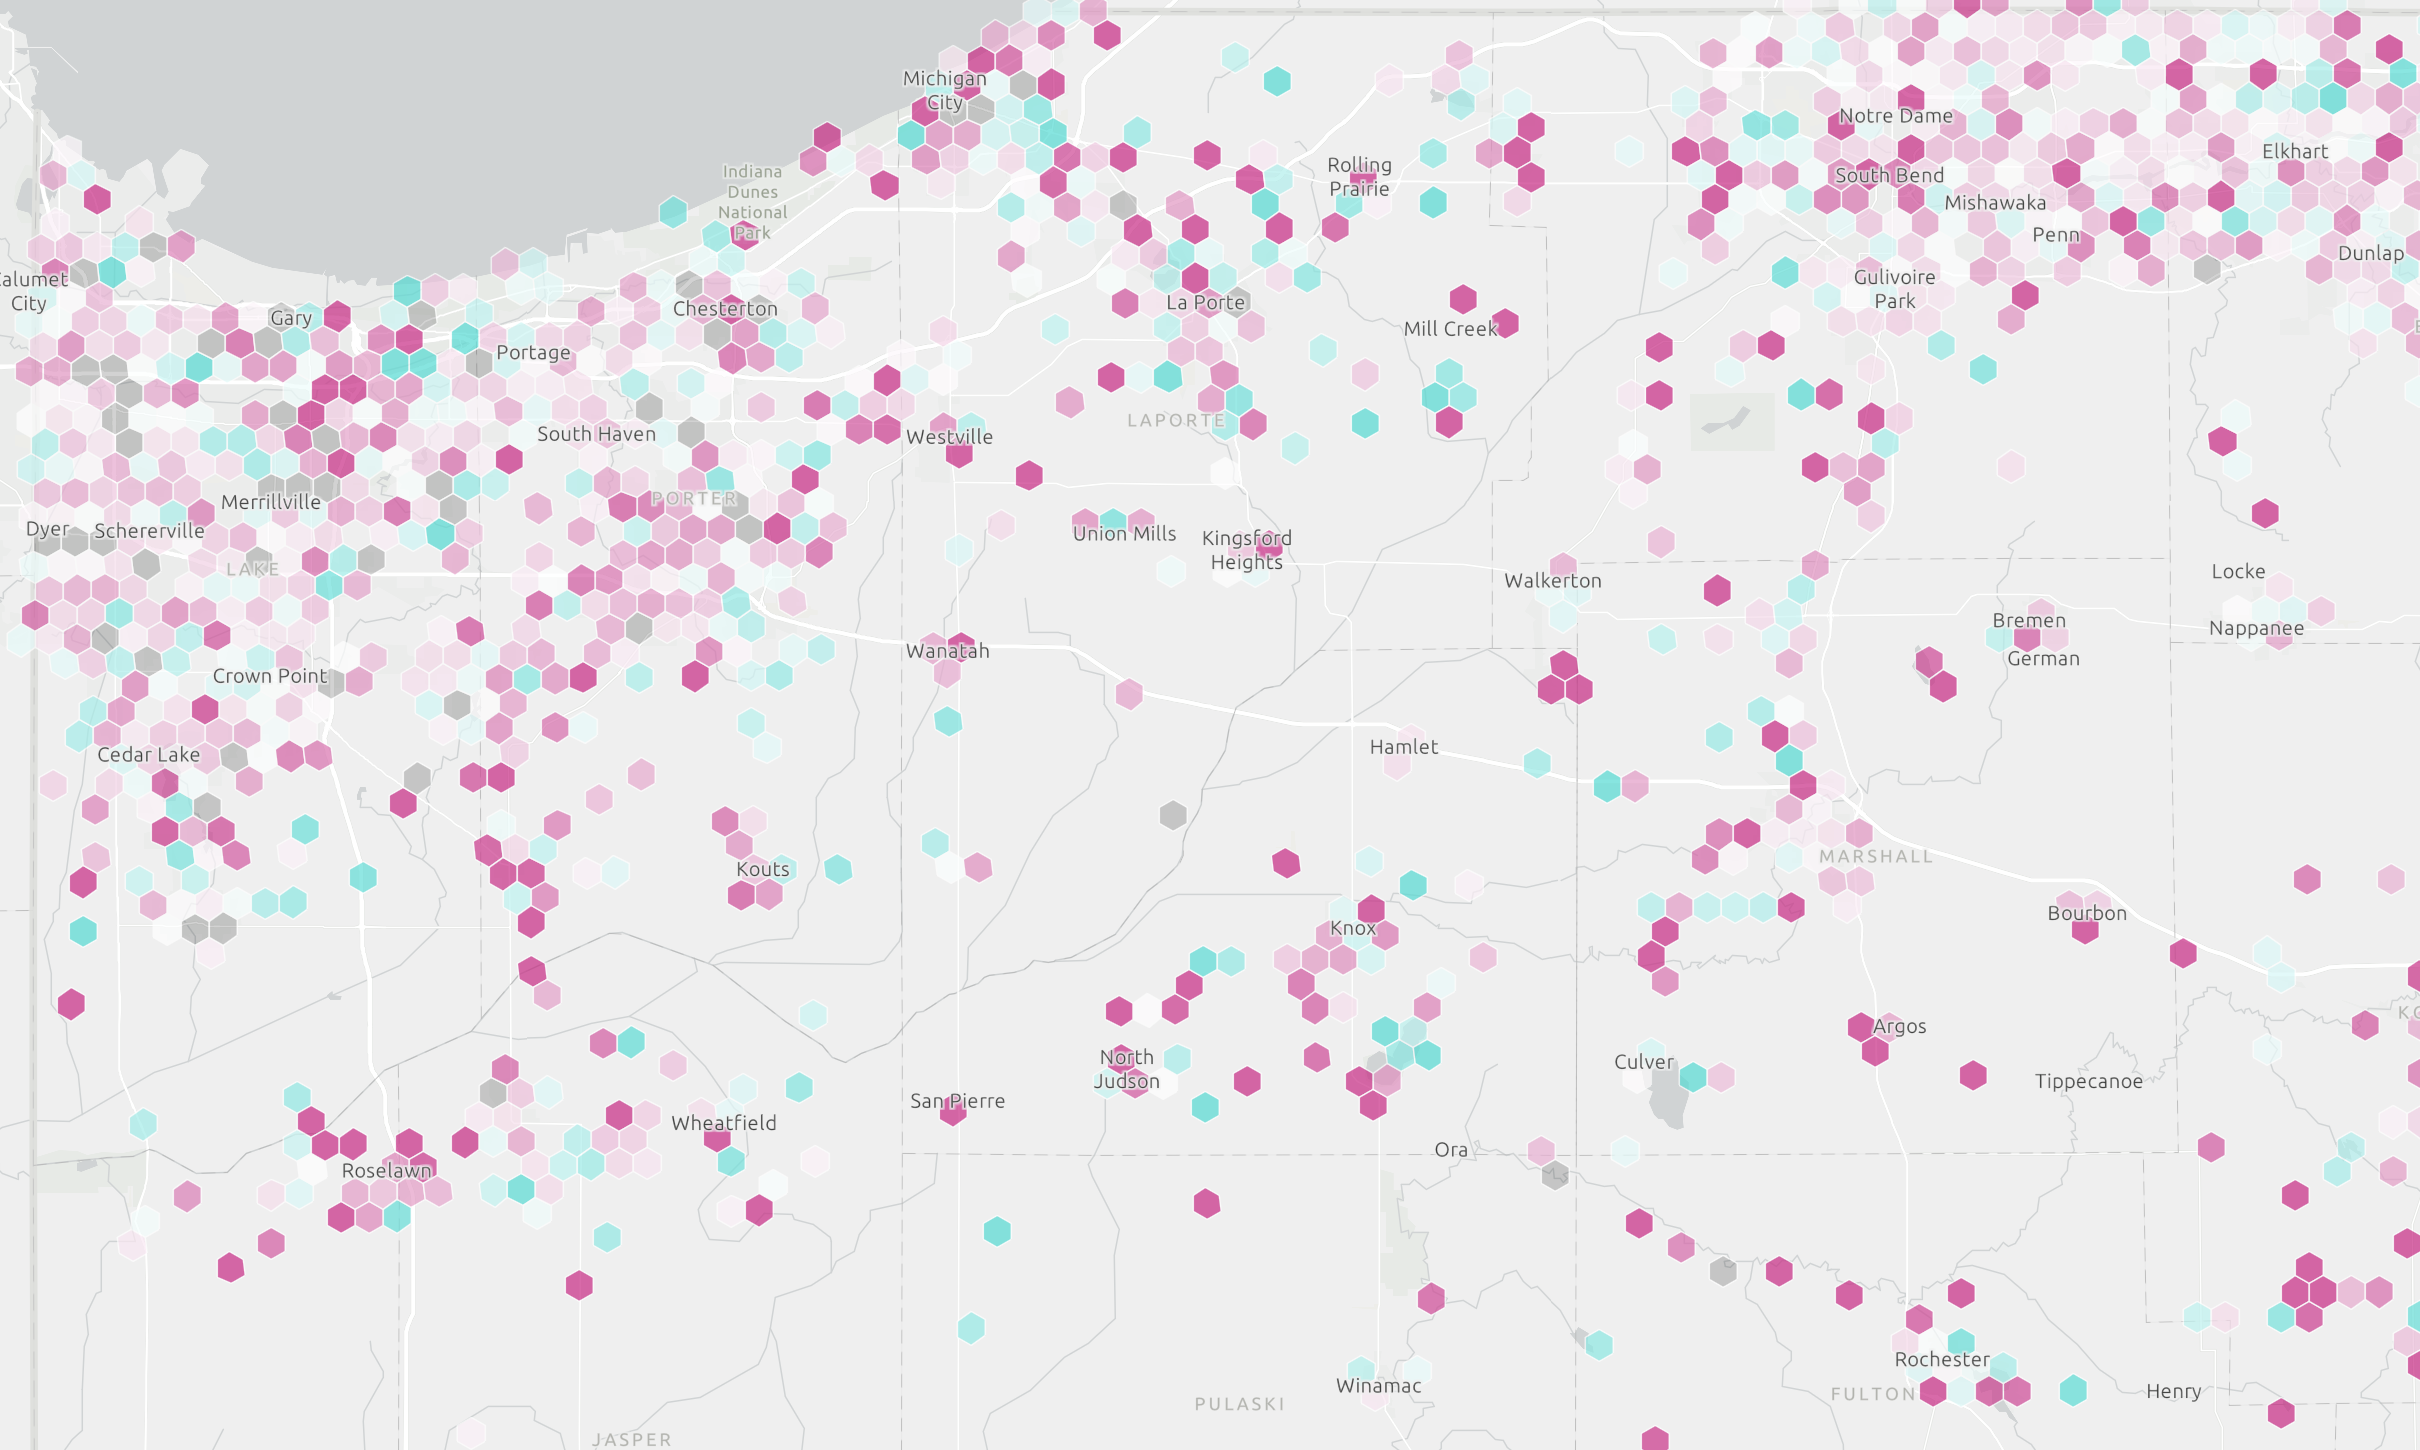 This interactive map shows how prices have changed in half-mile neighborhood areas.
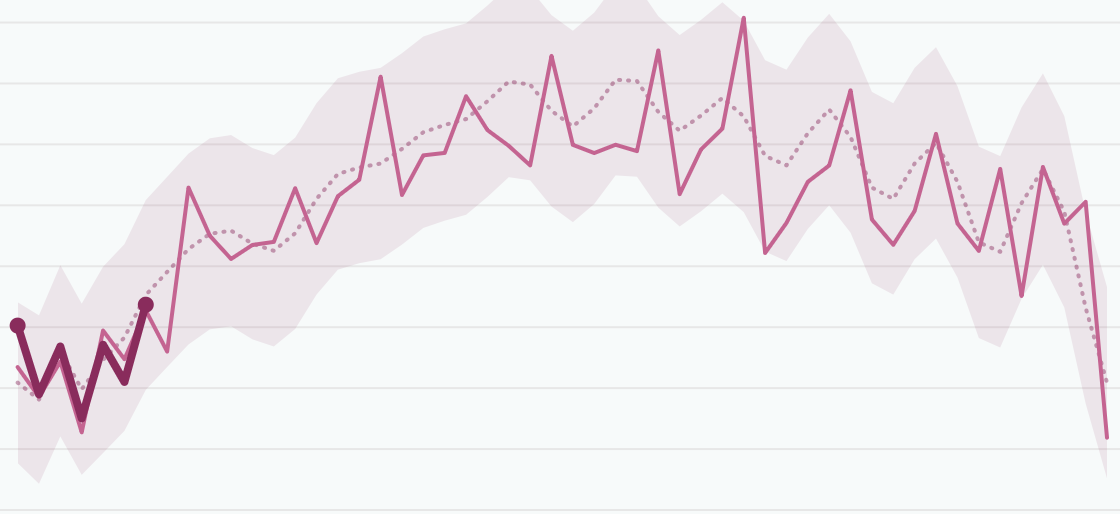
We link sales over time to accurately measure price appreciation. Sellers in the three months ending in February enjoyed 6.7% annual appreciation, down from 6.8% in January. Low-cost homes have stronger price growth than high-priced homes.

What does our market data tell us about price trends in 2025, and what insights can Indiana REALTORS® share with clients and partners about the outlook for home values?
 2024 finished with 78,400 sales, 300 more than last year, as elevated rates kept many homeowners locked in to their current mortgage. Still, listings grew by 3%, sales volume grew by 7%, and there was momentum to finish the year—sales were up 2.6% year-over-year in the last two quarters.
 Statewide median sale price grew by 4% year-over-year in the third quarter, but most metro areas in the state experienced price growth that was significantly faster or slower than the average.
We analyzed 12 months of sales from September 2023 to August 2024 to see if homes were under contract faster when listing prices were closer to the sale price. When the listing price was on target, 75% of homes sold in 14 days. Listings that have to come down in by price by even 5% can stay on the market for weeks.
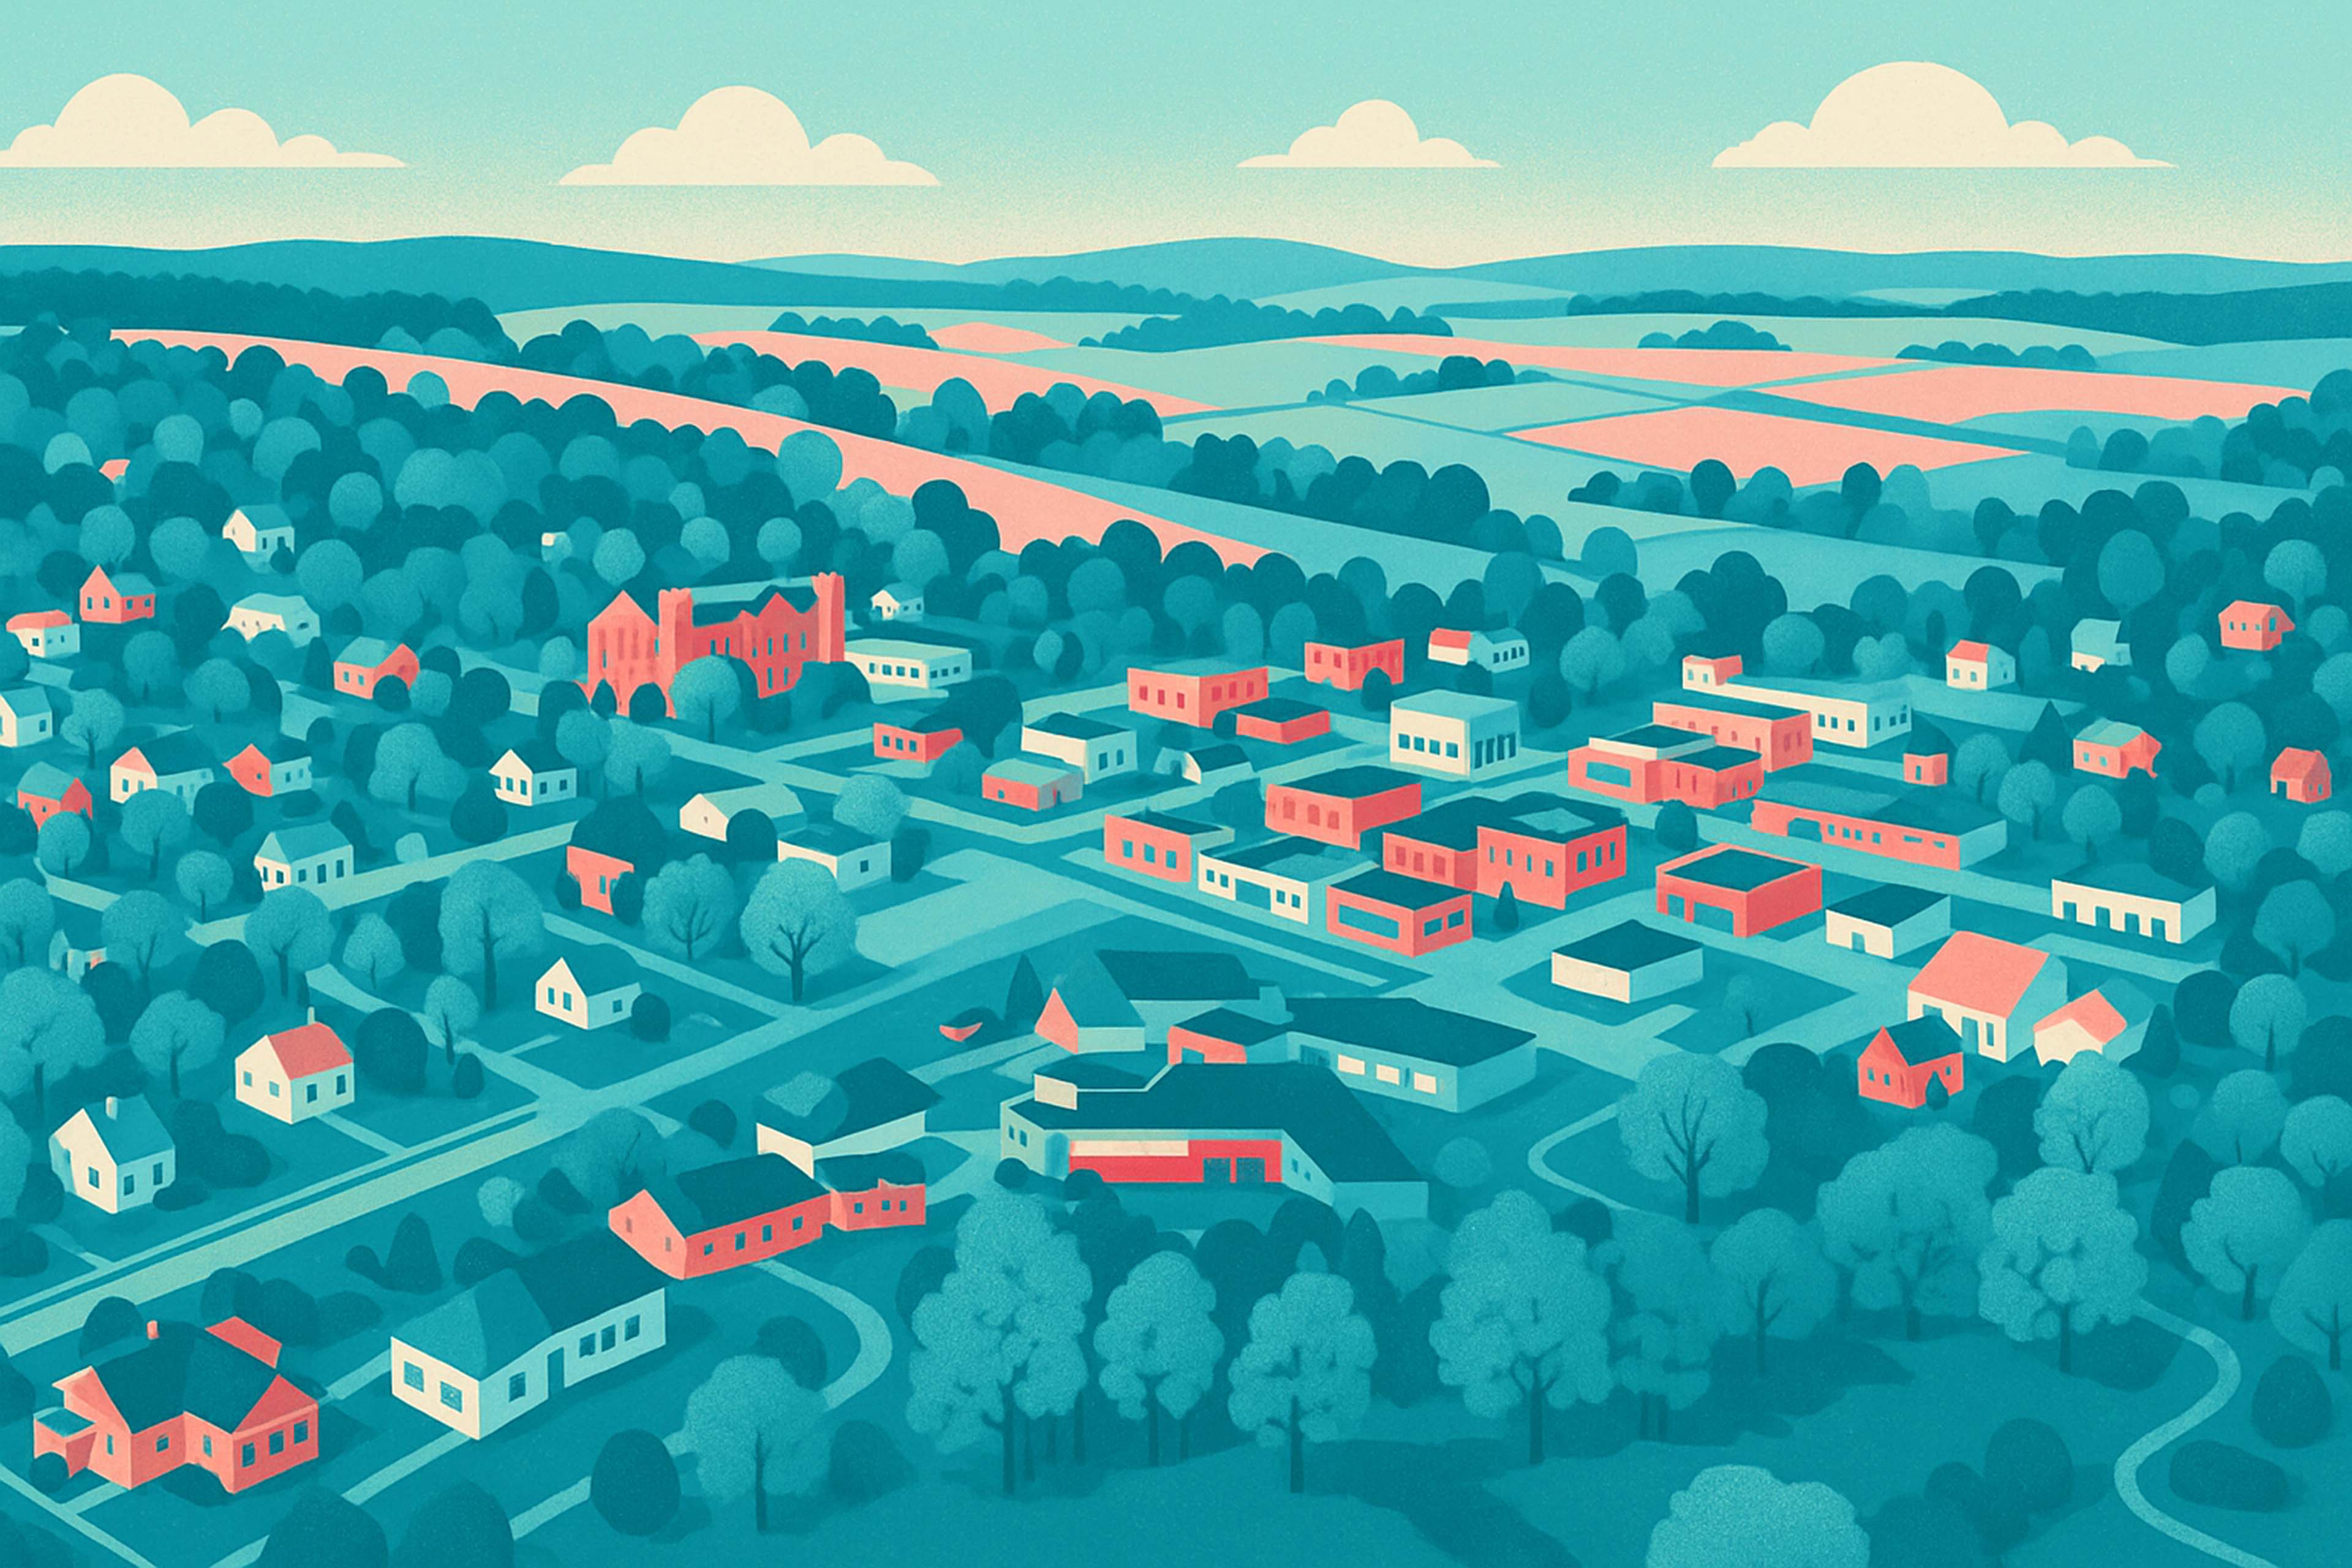
In larger cities across Indiana, older homes in neighborhoods near downtowns have experienced significant increases in sale price and volume over the past five years – leading a trend of rising home values and an overall price premium for walkable neighborhoods in urbanized counties.
Four out of five Hoosier households live in a metropolitan area. We explore market trends using the latest April 2024 data.
Using MLS sales and price data, we’ve created a statewide map showing home price changes through 2023 in half-mile ‘neighborhood-scale’ areas. This is a great way to see how property values are changing if you are considering buyer or buying or selling a home – but for current homeowners, it’s also a way to evaluate the accuracy of 2024 property tax assessments.
With rates averaging 50 basis points lower than last year, sales are up 2.5% year-to-date.
We forecast the state needs to double the rate of construction to meet housing needs by 2029.
The market has slowed, but not for everyone. Correctly priced homes still go under contract in about a week. The slowdown is concentrated in mispriced …
Indiana sellers see 5.4% annual appreciation in Q1 2026