Housing markets don't move in a straight line. Some places move fast but don't command strong prices. Others hold pricing power but sit longer. Looking at any single metric misses the real story.
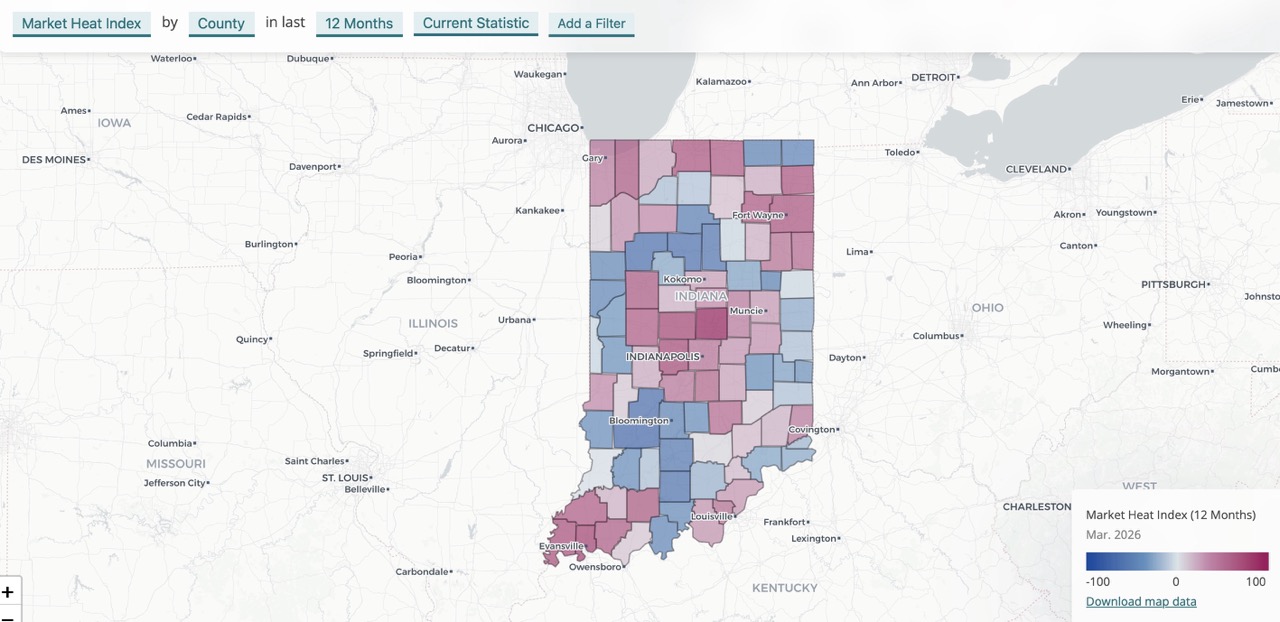
The new Market Heat Index in the IAR Housing Hub measures how tight a market is, not how large, and places each Indiana county on a scale from -100 to 100 relative to the rest of the state.
The index blends three signals: how quickly homes sell (days on market), how closely they sell to list price (sale-to-list price ratio), and how efficiently listings convert to pending contracts (pendings divided by listings). Each is standardized and averaged, then adjusted for transaction volume so a handful of deals in a small county don't skew the rankings. The score reflects pressure, the interaction between demand and available supply.
A high score means homes are selling fast with minimal price discounting, and the number of contracts is keeping pace with new listings. A low score means longer days on market, weaker pricing power, softer demand.
We publish this for counties, ZIP Codes, and townships at periods ranging from 12-month averages down to one-week snapshots. We recommend using the three-week average for a current signal, because weekly data can be noisy. We also suggest balancing small areas with longer timeframes to reduce noise: If you want to look at ZIP Codes, monthly or quarterly numbers will be more reliable than weekly.
Below, we look at the results for counties over the long term (12-month average) and short term (three-week average).
Hamilton County sits at the top of both rankings. Over twelve months it scores 96 out of 100, the strongest reading in the state by a wide margin. Over the past three weeks it's dropped to 59, and the reason is worth understanding. Days on market have actually risen year-over-year, up 32% from the twelve-month baseline, which is pulling its speed score down even as pricing and absorption remain strong. Homes are still closing within 3% of list price and pending contracts are keeping pace with active listings nearly one-to-one. It's still the tightest county in Indiana. It's just not running quite as hot as it was.
Johnson County is the most notable example of a market that looks strong over twelve months but has cooled noticeably in recent weeks. Its twelve-month score is 59, placing it among the stronger suburban Indianapolis counties. Its three-week score is 10. The culprit is pending contracts, which are down 18% year-over-year. There are 80 pendings for every 100 listings over the last three weeks, and that is below average.
Posey County shows the sharpest divergence of any prominent market: down 91 points between the twelve-month and three-week windows. The pricing signal has dropped, with homes now selling closer to 91 cents on the dollar versus the 96-cent average over the past year. Pending contracts are flat year-over-year, but the absorption rate has fallen from 90 to 71 contracts per 100 listings, meaning listings are sitting longer relative to demand. For a small-volume county, that kind of swing can reflect a handful of slower weeks, but the pricing pressure drop is harder to explain away.
Gibson and DeKalb tell similar stories. Both were strong over twelve months and have seen pending contracts fall sharply in recent weeks. Gibson's pending volume is down 46% year-over-year in the short-term window. DeKalb's is down 44%. In both cases, days on market have actually improved, so homes that do go under contract are moving quickly. The issue is fewer of them are going under contract.
Dubois County's short-term softening has a different character. Days on market have risen 83% year-over-year in the three-week window, the steepest increase among the counties showing notable drops. Pricing has held and pending volume is only modestly lower, suggesting the slowdown is more about hesitation at the front end of the process than buyers walking away.
Clinton County is the most interesting county in the current data. It ranks second in the three-week window, just behind Hamilton, but sits much lower in the twelve-month picture. The reason is concrete. Sales volume has doubled year-over-year in the past three weeks, and pending contracts are up 77%. Days on market have dropped 21%. Absorption has climbed: pending contracts are outpacing active listings by 30%, one of the strongest readings in the state right now. Whether that reflects a genuine demand shift or a short-term inventory squeeze, the near-term pressure is real and measurable.
Orange County ranks as one of the biggest upward movers in the state, gaining nearly 93 points between its twelve-month score and its recent three-week reading. Over the past year it was one of Indiana's coldest markets. Right now it's showing some of the sharpest short-term improvement in the state. Greene County shows a similar pattern, up over 80 points from a twelve-month score that placed it at the very bottom of the rankings.
These are small-volume markets, so the index adjusts for that. But when you see a county move that far that fast, it's either a genuine tightening or a data artifact from a few quick sales. Either way, it's the kind of signal worth a closer look before dismissing.
Lawrence County is the one market that stands out for consistent weakness in both windows. It ranks near the bottom over twelve months, with homes averaging 51 days on market and a pending-to-listing ratio of just 0.47, meaning fewer than half of active listings are converting to pending contracts. The short-term picture offers no relief: average days on market over the past three weeks sits at 48 days, and only 3 out of every 8 listings have gone pending. For agents working Lawrence County, this data reflects what they're likely already experiencing on the ground.
Indiana's housing pressure right now is neither uniform nor concentrated in one place. Hamilton, Hendricks, Boone, Vanderburgh, St. Joseph, Allen, and Tippecanoe continue to show sustained tightness across both time windows. But the short-term data is picking up real movement in places that rarely lead statewide rankings, while some historically strong markets are showing early signs of softening.
The Market Heat Index doesn't replace individual metrics. It just makes them easier to read together: speed, pricing power, and demand relative to supply in one number, so you can see where the pressure is, where it's building, and where it may be starting to ease.