The “one-two punch” of rising prices and elevated mortgage rates poses a dire threat to the prospect of homeownership; ask any real estate professional about the challenges facing their buyer clients and the housing market generally and affordability will be at or near the top of the list.
In Indiana, the median home price has risen more than twice as fast as median household income since 2014, jumping 52% from 2019 through 2024. Mortgage rates averaging 6.75% in 2023 and 2024—and remaining above 6.8% through the end of February—add significantly to the affordability hurdle, especially for buyers with tight monthly budgets.
What does our market data tell us about price trends in 2025, and what insights can Indiana REALTORS® share with clients and partners about the outlook for home values?
Comparing the median sale price of homes across Indiana versus the U.S. (as reported by NAR) shows a significant advantage: Indiana’s 2024 median price of $255,000 is more than 35% lower than the U.S. median ($407,600).
Using American Community Survey (ACS) 2023 estimates of owner-occupied home value tells a similar story – Indiana’s median value ($201,600) is 34% less than the nation’s ($303,400).
Indiana’s household income ($70,051 – again using 2023 ACS estimates) is roughly 10% less than the U.S., but significantly more affordable housing costs still create a cost of living advantage.
The typical mortgage payment for a median-priced home in 2024 (assuming a 10% down payment with PMI, a 6.85% rate and the state average effective property tax rate) is about $1,870 in Indiana, or 32% of median monthly income.
The monthly mortgage payment nationally using the same parameters is $2,990, or 45% of monthly income.
Even with this context, it’s undeniable that home prices have risen sharply and strained the ability of middle-class Indiana households to buy into the market – especially without the benefit of pre-2022 mortgage rates. But price growth has eased over the past two years.
Chart 1. Indiana home price appreciation
Year-over-year growth of median sale price
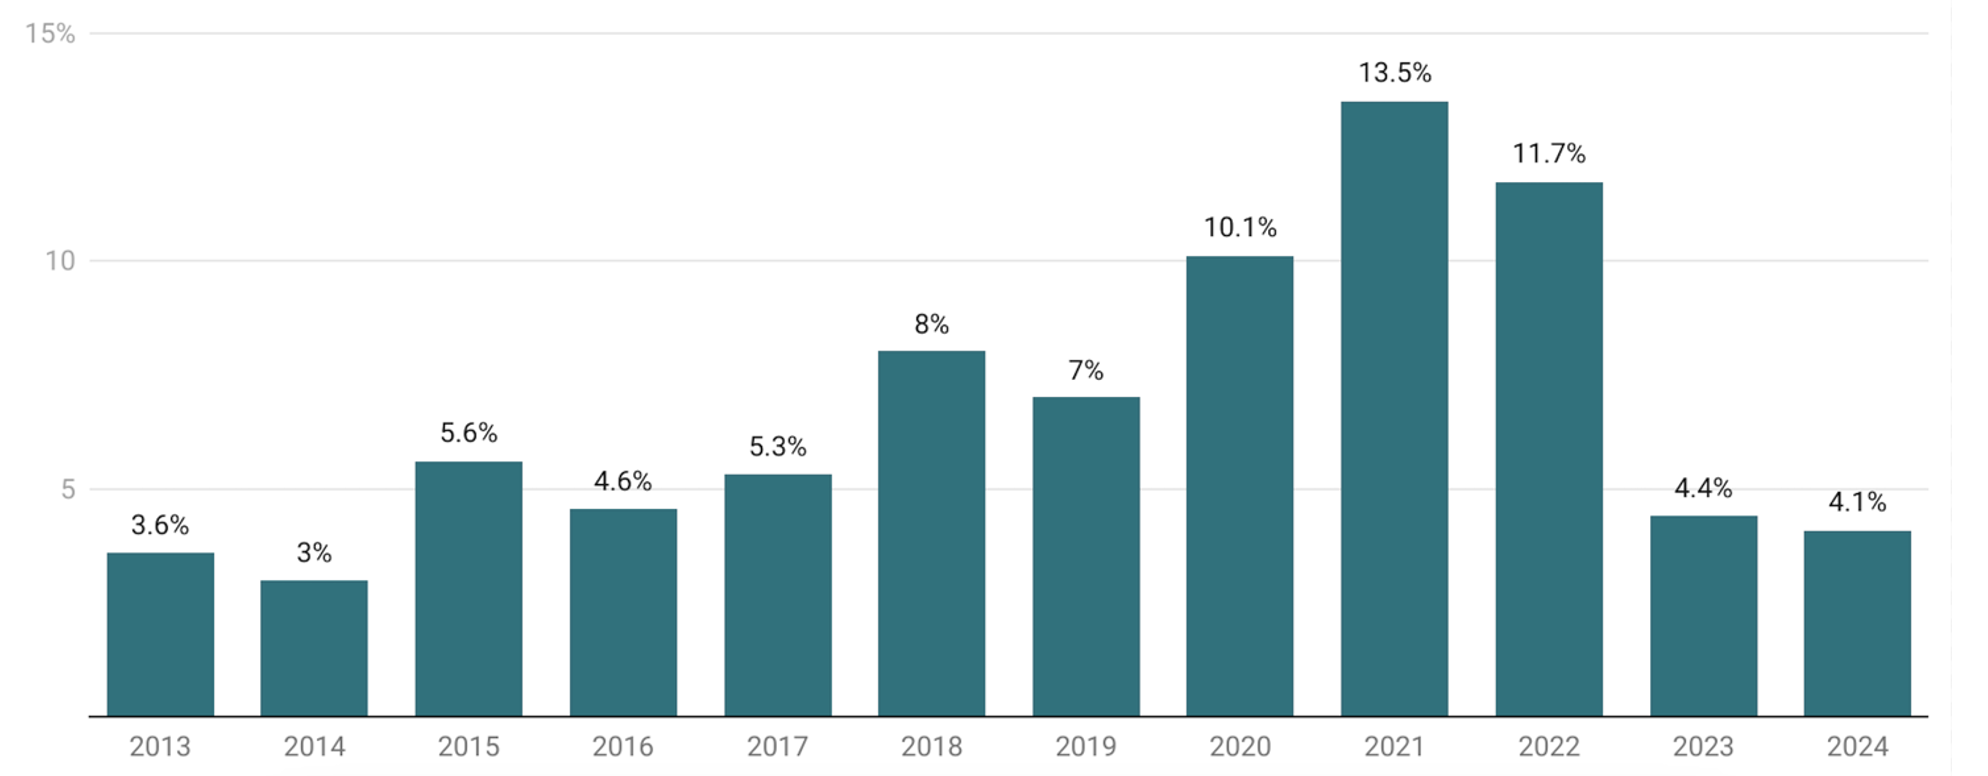
The median sale price for a home in Indiana has grown from $122,000 in 2013 to $255,000 in 2024; nearly half this growth occurred from 2018 through 2022. As indicated in Chart 1, price growth in 2023 and 2024 has fallen to the lowest rate since 2014. (Coincidentally, closed sales also dropped to 2014 levels over the last two years.)
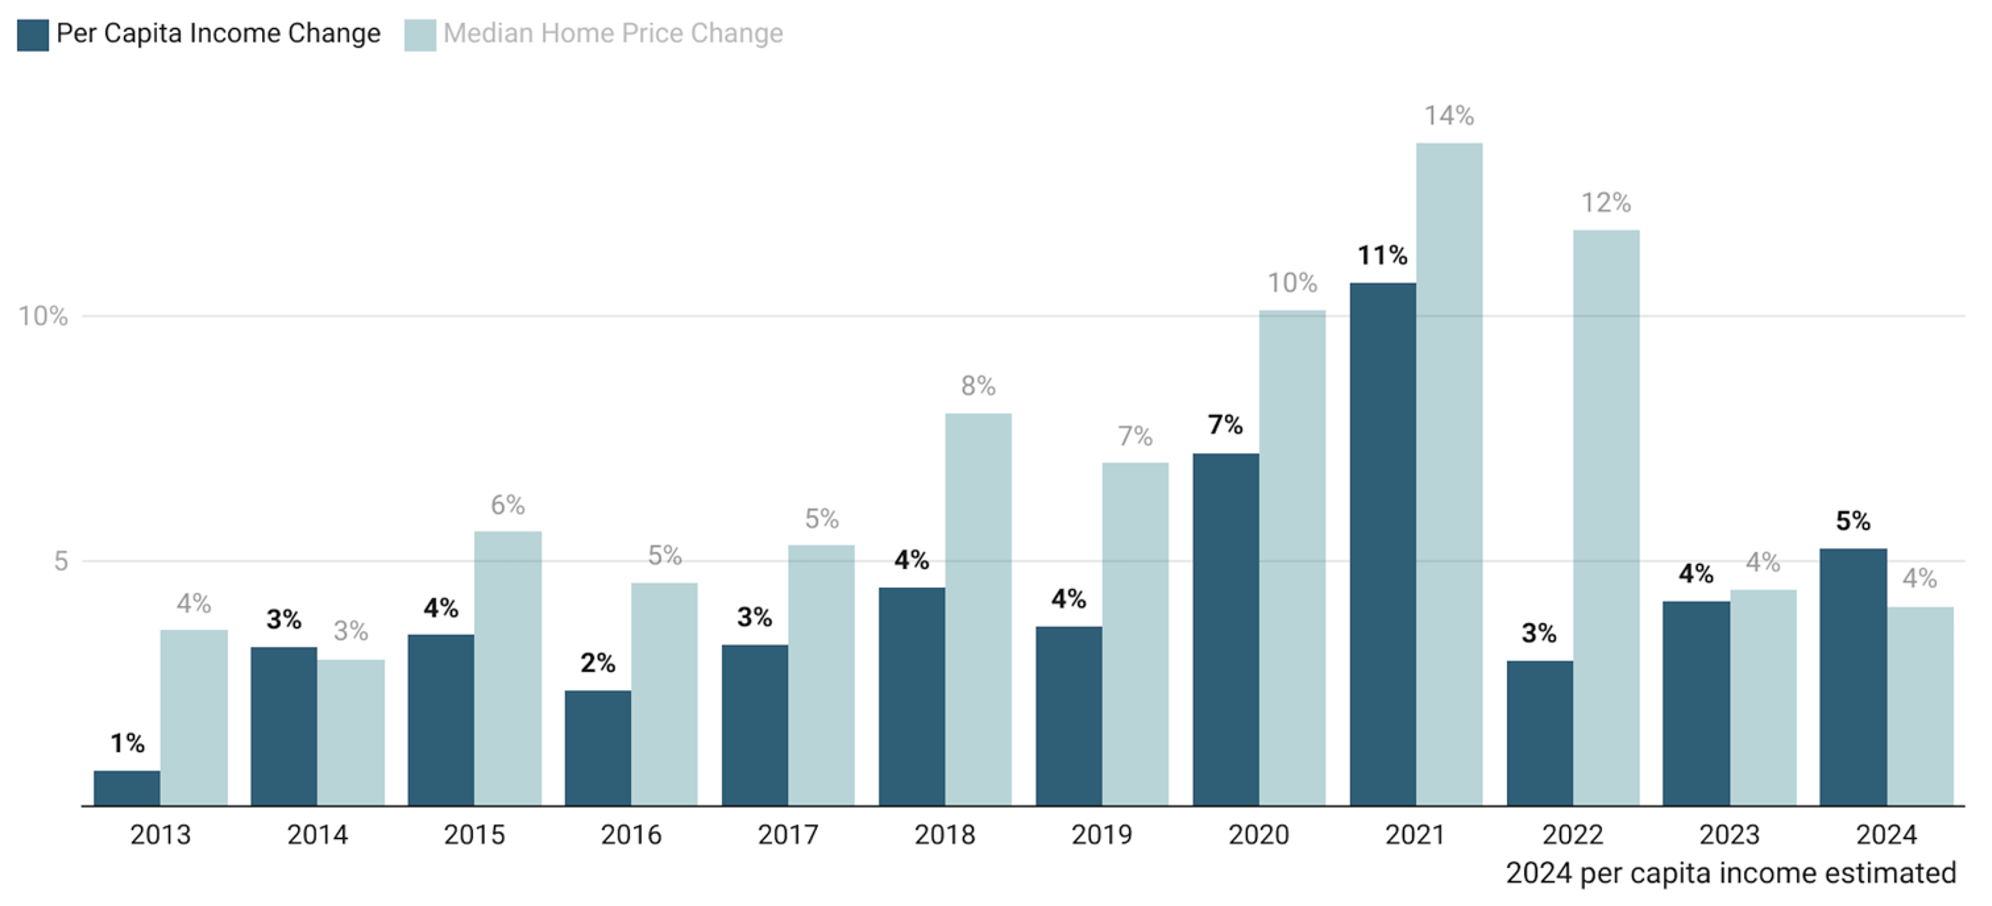
In fact, adding and highlighting Indiana’s per capita income growth to home sale price appreciation (Chart 2), shows the most favorable balance between income and housing in a decade. Through the first three quarters of 2024, personal income was growing at a faster pace than home prices for the first time since 2014.
Of course, comparing annual growth rates as discrete events is deceiving, as prices continue to hit all-time highs (though advancing at a slower annual pace) while income has to catch up from accumulated years of slower growth.
Chart 2. In 2024, income grew faster than home prices for the first time in a decade
Per capita income growth compared to year-over-year median price growth
Home prices rise as more buyers compete for a limited number of listings; prices fall when the supply of homes for sale outgrows homebuyer demand. The impact of elevated mortgage rates on demand is obvious, with statewide closings plummeting 25% from 2021 through 2024.
But supply is also driving prices in a buyer-friendly direction. Indiana’s inventory of homes for sale is still below pre-2020 levels and has seen significant decline since 2010, which has helped keep prices rising faster than inflation. But rising year-over-year inventory since 2022 has coincided with a significant drop-off from the double-digit price growth of 2020-2022.
Chart 3. Home prices grew faster as inventory tightened
Indiana home price appreciation and inventory change
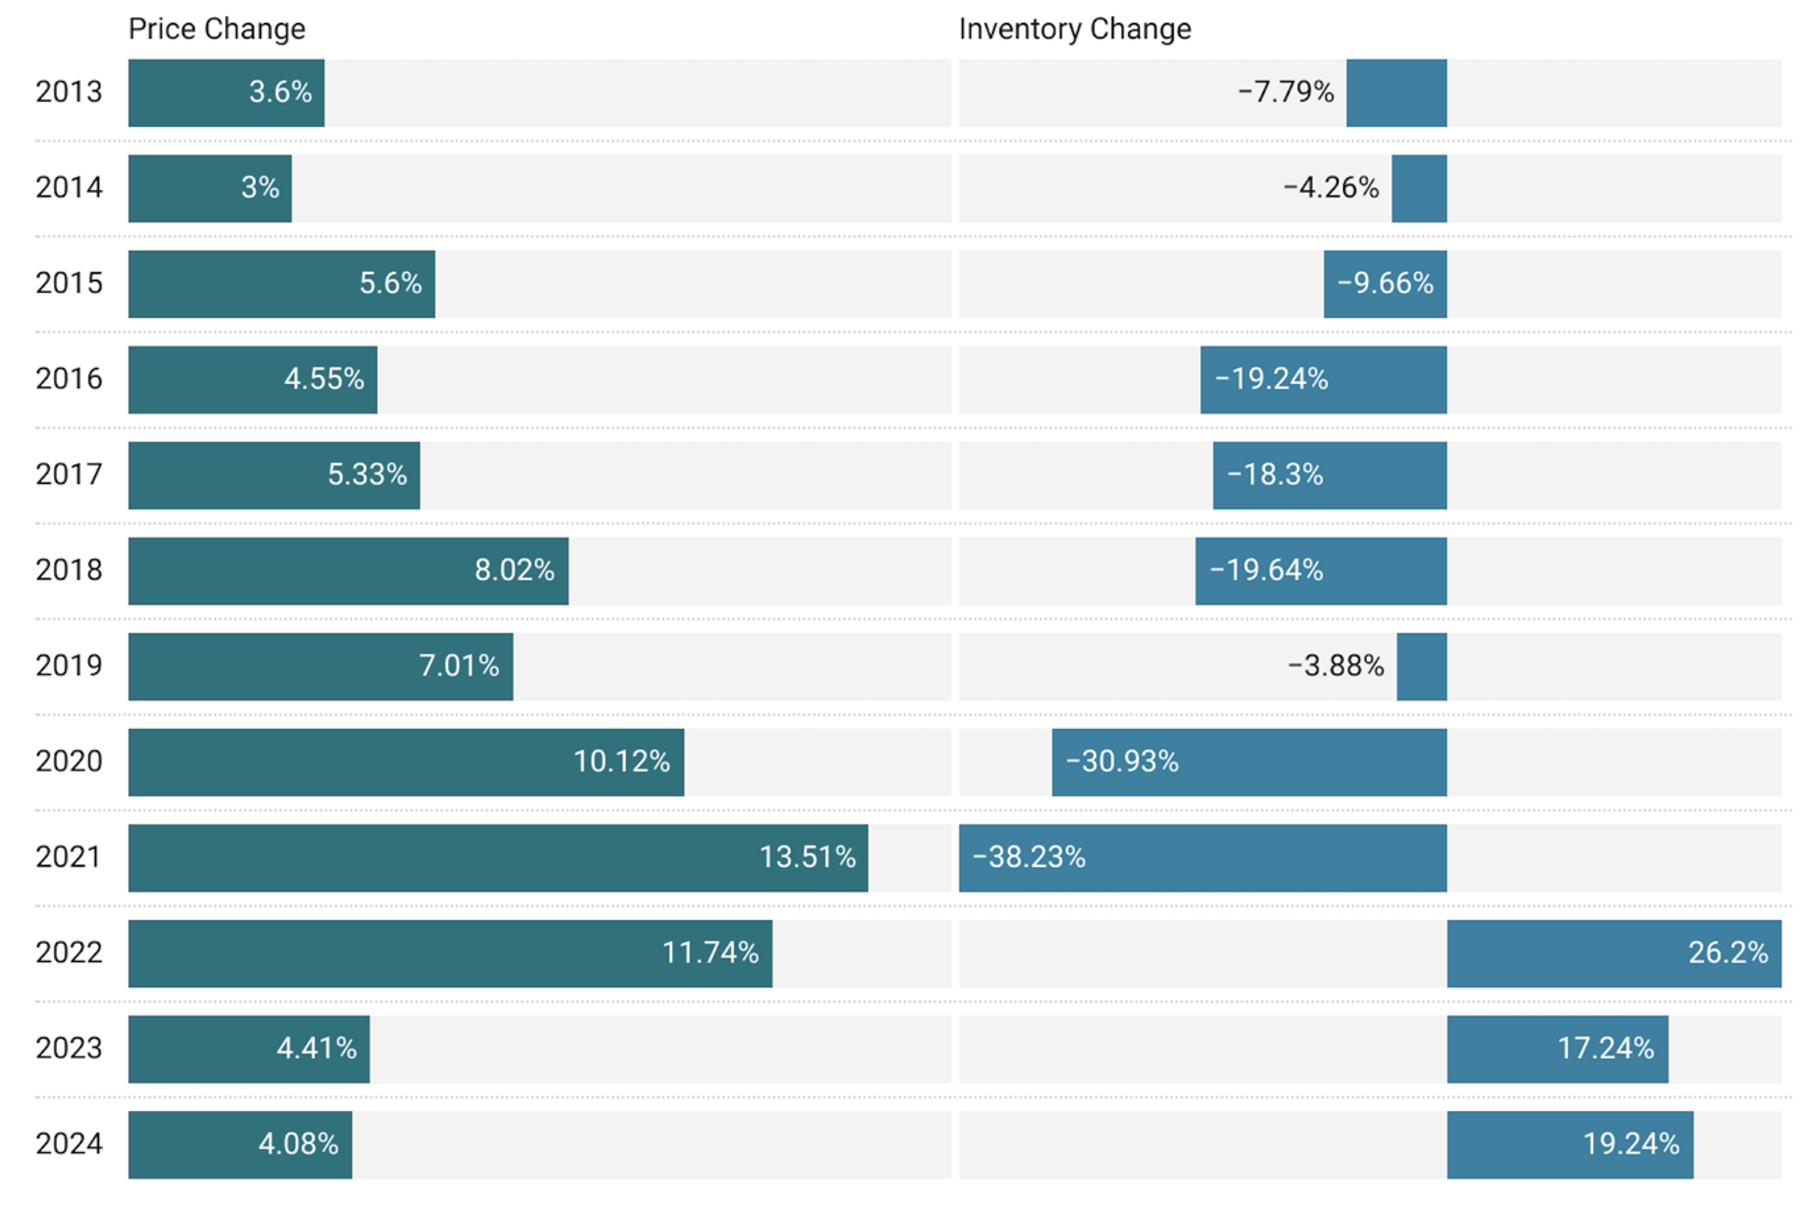
Chart 3 shows how rising prices from 2017 through 2019 coincided with accelerating inventory loss from 2016 heading into 2019 and the hyper-competitive pandemic market. But positive year-over-year inventory trends in 2023 and 2024 are accompanied by annual price growth less than 5%.
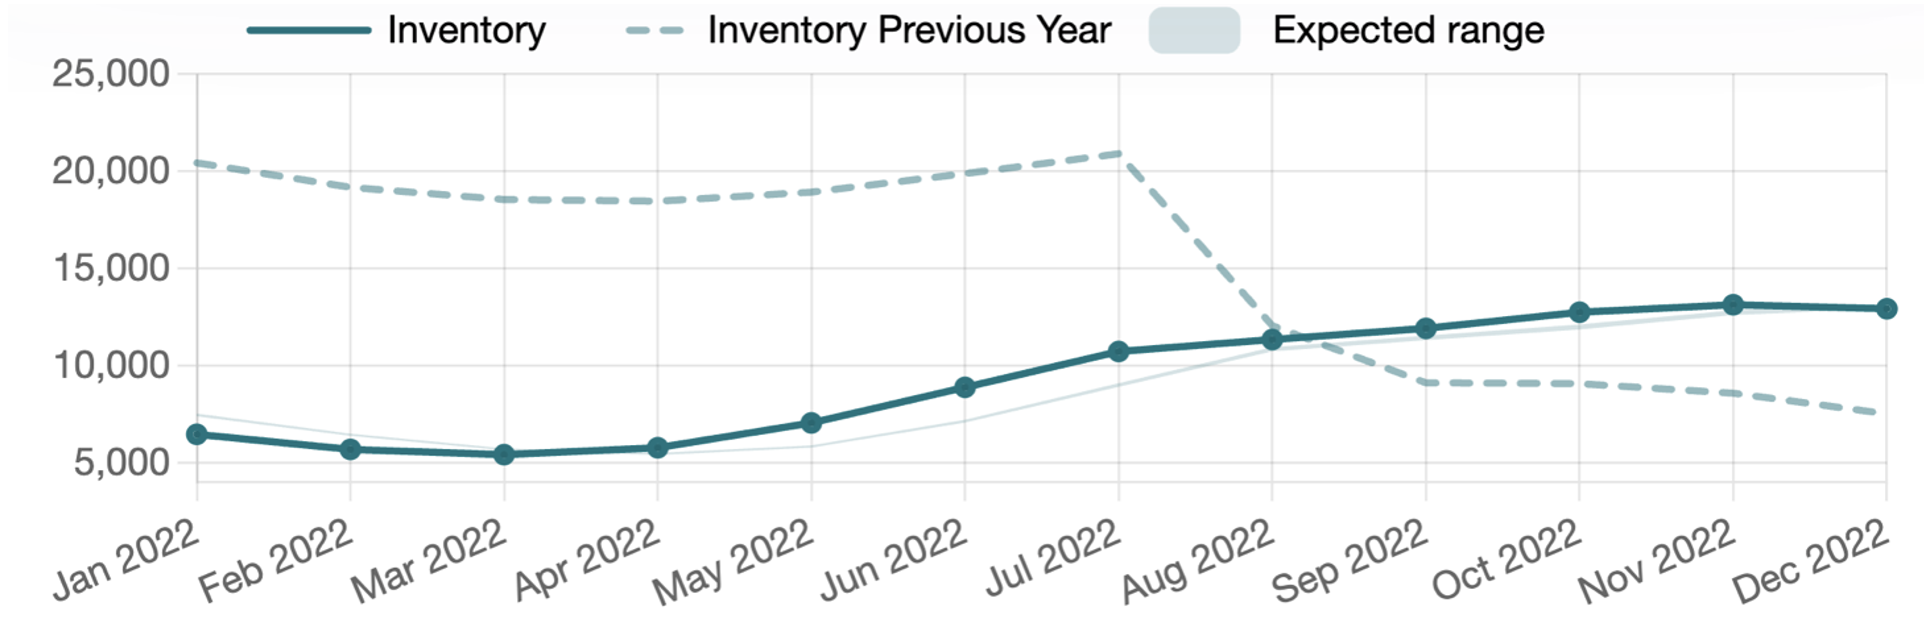
2022 shows positive inventory and strong price growth, but taking a closer look at monthly data provides an explanation: 2022 inventory (the dark green line in Chart 4) only passed 2021 (the dotted green) at the end of the summer to create a positive year-over-year trend. This was only after nearly three quarters of strong price growth (fading after Labor Day) boosted the annual median nearly 12% above 2021.
Chart 4. Supply was tightening through most of 2022, driving prices up
Looking at year-over-year median price and inventory changes on a monthly basis over time (Chart 5) shows more clearly how falling inventory coincides with stronger annualized price growth; see 2018 into 2019, and more dramatically in 2020-2021. Prices moderate as supply conditions improve – this was happening in 2019 before COVID impacted the market and is most obvious from the latter part of 2022 through much of 2024.
Chart 5. Price growth has been slower since 2023, when inventory began to grow
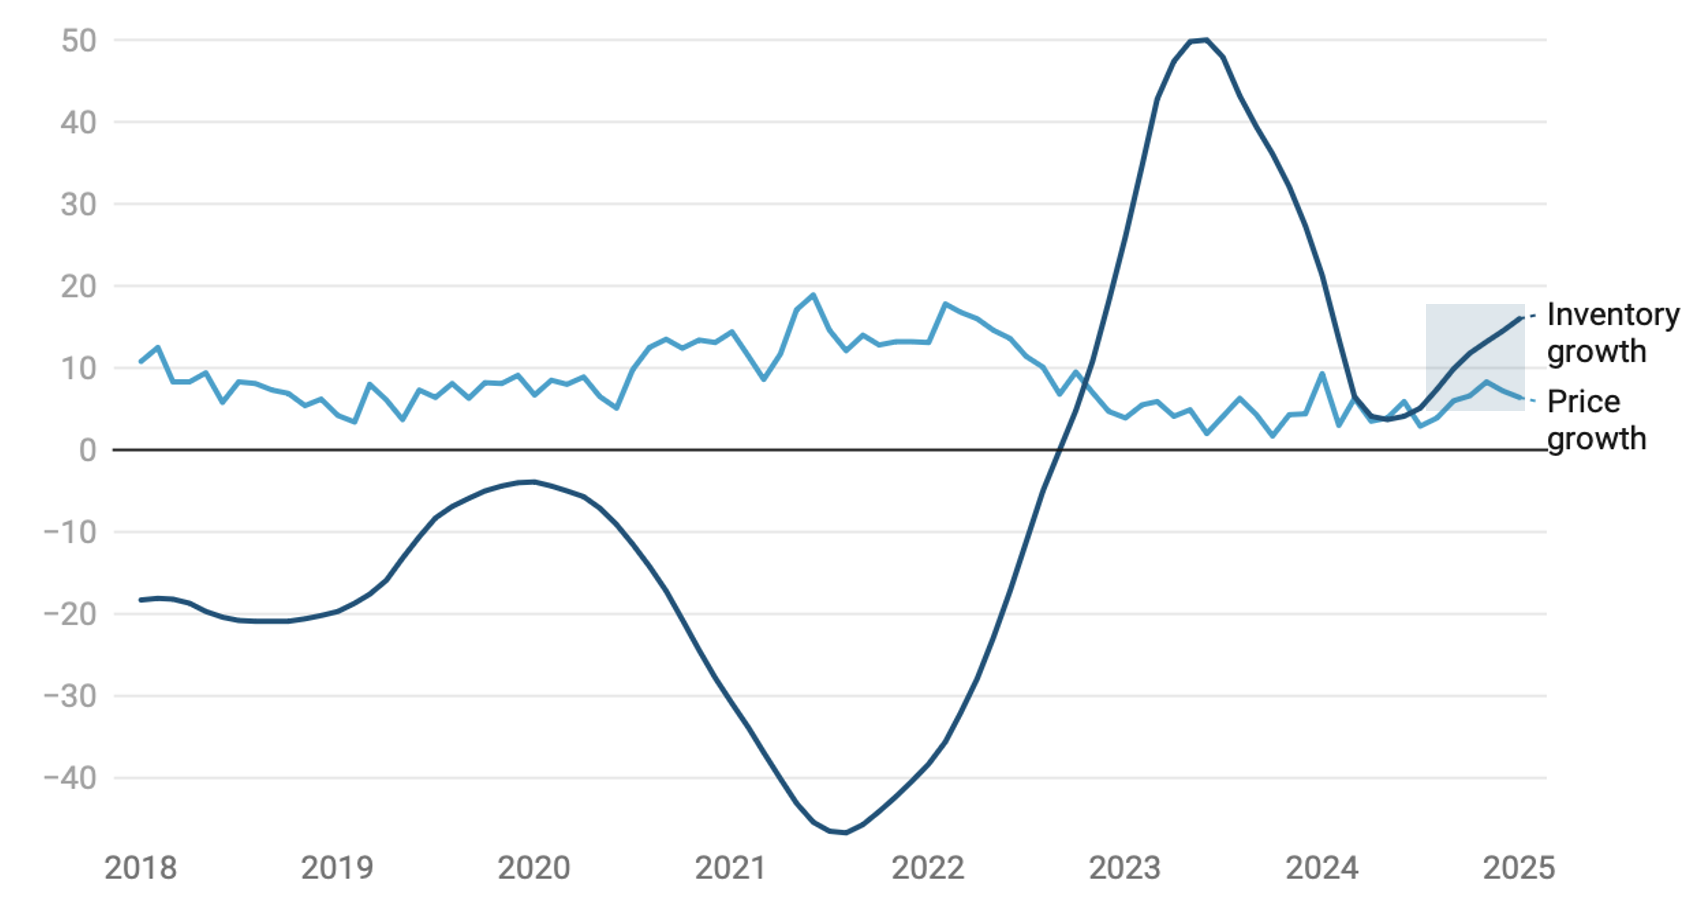
As inventory continued to hover 16% above 2024 through January 2025, one might anticipate year-over-year price growth continuing below 5% to begin 2025; in reality, January’s $250,000 median was 6% higher than January 2024.
In fact, year-over-year price appreciation ticked up to 7% from September through January (the shaded area of Chart 5) after averaging 4% from January through August. This could be dismissed as a stretch of aberrant data but may have a more significant explanation.
The 30-year mortgage rate (via Freddie Mac’s Primary Mortgage Survey) also rose a full point from mid-September 2024 through mid-January 2025.
As noted in the opening of this brief, higher rates have a greater impact on homebuyers with moderate budgets or who may be stretching to afford their projected monthly mortgage payments. Buyers with more financial wherewithal are less sensitive to rates (often financing less of their home purchase with new borrowing).
With this in mind, Chart 6 shows how higher rates have essentially cleaved Indiana’s real estate market into two segments: Sales below $250,000 are down 7% over the twelve months ending in January versus the previous 12-month period, while closed sales above $250,000 are up 8%.
Chart 6. In 2024, sales below $250K fell 7%, above $250K are up 8%
Indiana home sales in 2024 compared to sales in 2023
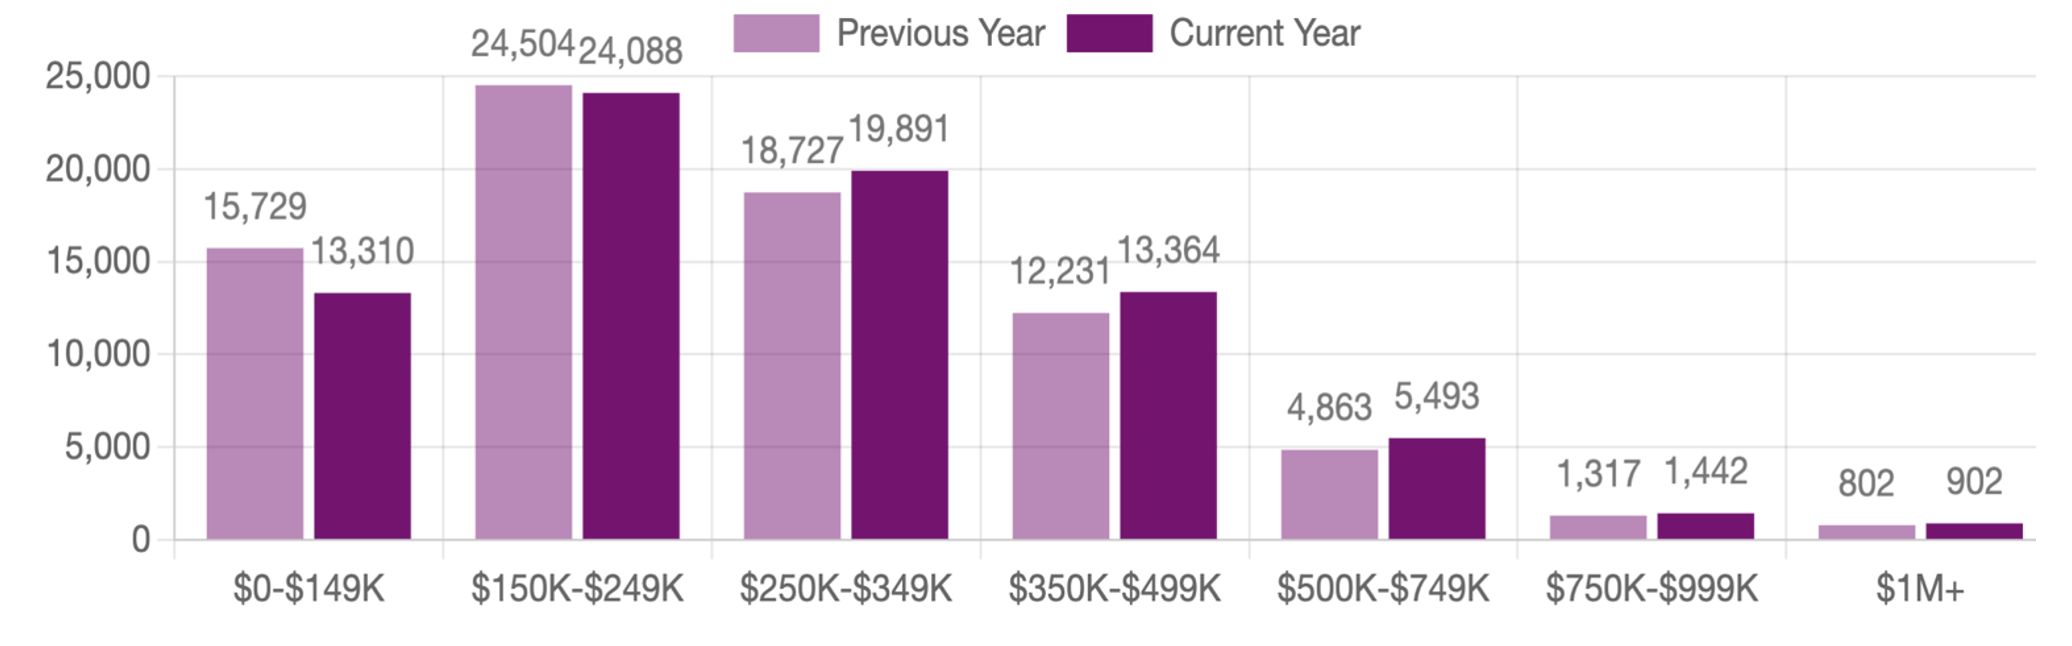
The uptick in year-over-year price appreciation over the past five months isn’t due to uniform rates of increase among price categories, but a larger share of higher-priced sales as closings below $250,000 fell from the previous period.
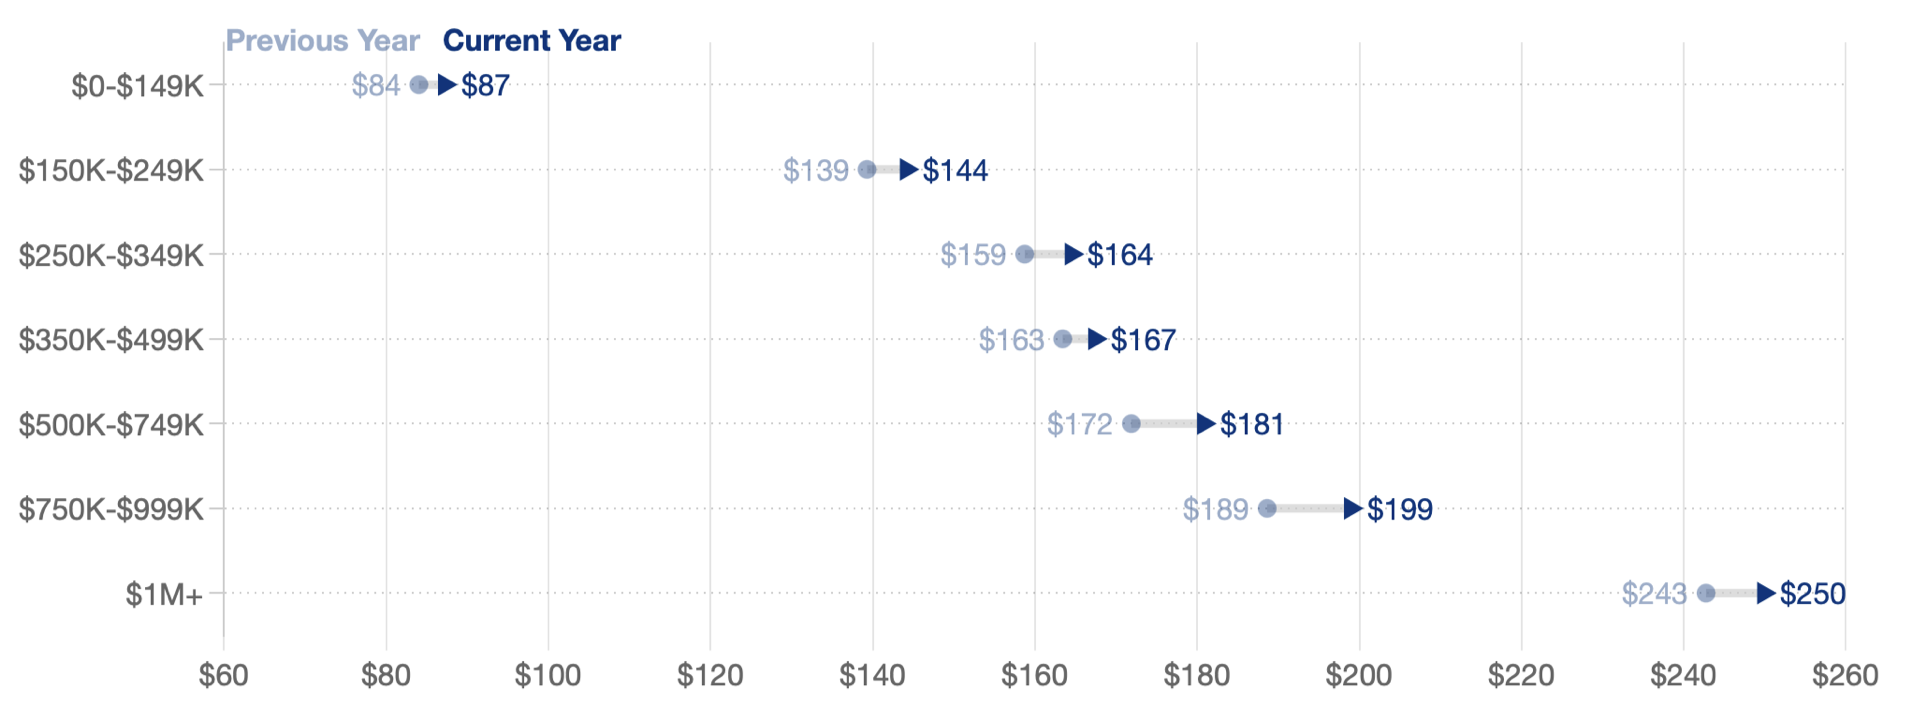
On a price-per-square-foot basis, we see that a more competitive market also led to higher price growth within the higher-priced market segments: Price-per-square-foot among homes sold between $500,000 and $1 million grew roughly 5.3% over the past twelve months (through January); the price-per-square-foot of homes that sold between $150,000 and $350,000 rose about 3.5% - see Chart 7.
Chart 7. Median price-per-square-foot grew by 5.3% for $500K-$1M, 3.5% for $150K-$350K
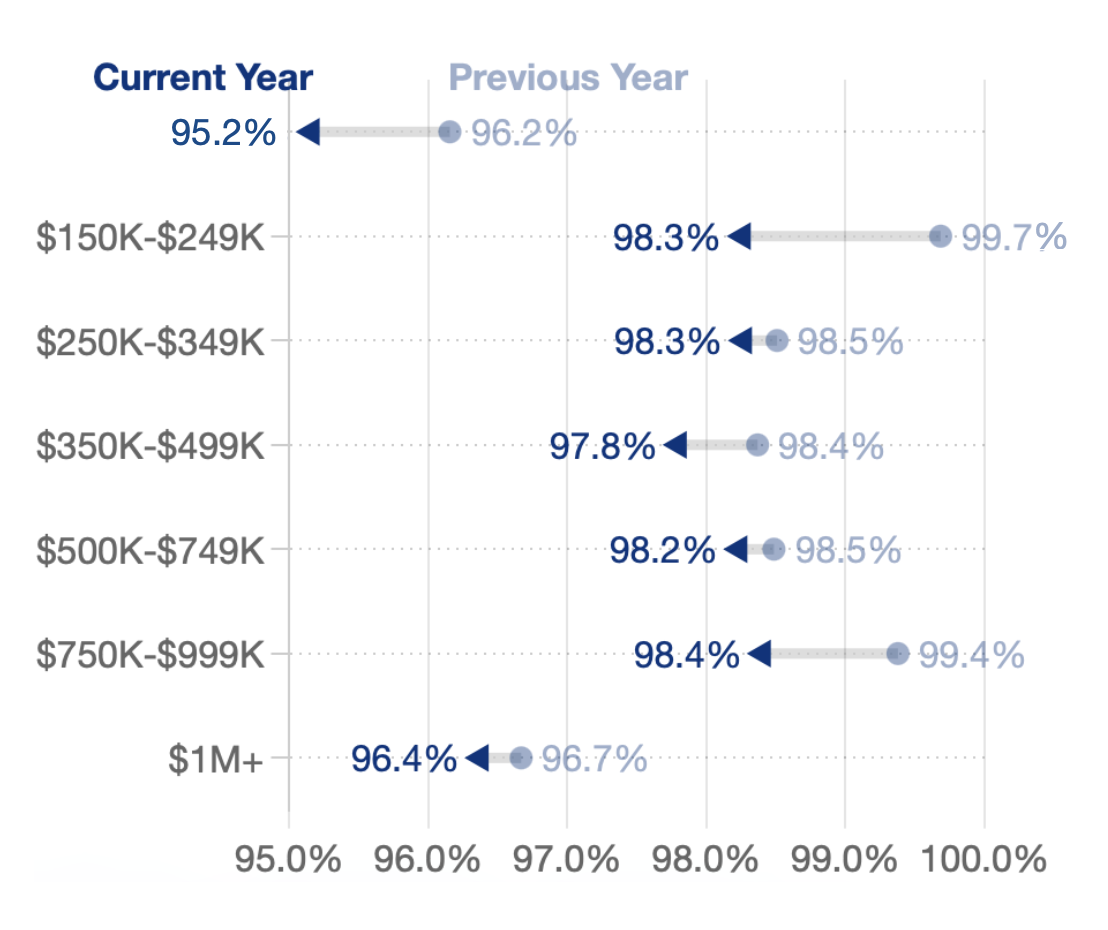
One more way to assess slowing homebuyer demand at and below the median price is the negotiating leverage of these buyers; with higher supply and less competition, buyers pay less of the original list price. Looking at trends by price category over the last twelve months (in ), we can see the largest decline in percentage of original list price in the final sale price below $250,000 – most notably from $150,000-$249,000.
Chart 8. Buyer’s negotiating position improved dramatically for homes below $250K
Sale price as percent of asking price, 2024 vs. 2023
These trends have led to a market with more options for buyers, especially around the median home price:
Taken together, these data suggest a more positive price climate for homebuyers. Of course, overall affordability will also improve with mortgage rates continuing to move downward as they’ve done for six straight weeks through the end of February (trending below 2024 for the first time this year over the last two weeks).
The key points: