
Indiana REALTORS® have long recognized a statewide decline in residential inventory — the number of homes available for sale, primarily through regional Multiple Listing Service (MLS) marketplaces.
In 2013, as the state’s housing market had fully emerged from the trauma of the Great Recession, there were roughly 40,000 properties listed on an average day across Indiana’s MLSs. By 2016, however, that number had fallen to just over 28,000.
Focusing on the last decade: Inventory continued to slide, even dipping below 8,000 in 2021 amid the hyper-competitive pandemic-driven market. Increasing mortgage rates impacted demand and led to year-over-year increases in supply from 2022 to 2026 (year-to-date). But even though inventory had climbed back to nearly 16,000 average daily listings last year, this means our statewide supply of housing available via the MLS declined 44% from 2016 through 2025-2026.
Download your housing study
Understand Your County's Housing Needs
Housing needs dashboard for every county and region, downloadable and shareable.
Over the same period, Indiana’s population grew by nearly 300,000 residents living in 200,000 new homeowner (owner-occupied) households. These numbers include a consecutive streak of eight years (and counting) of positive net domestic migration from 2018 through 2025 that saw 45,000 more new residents move into Indiana from other states than departed – a total that leads the Great Lakes states.
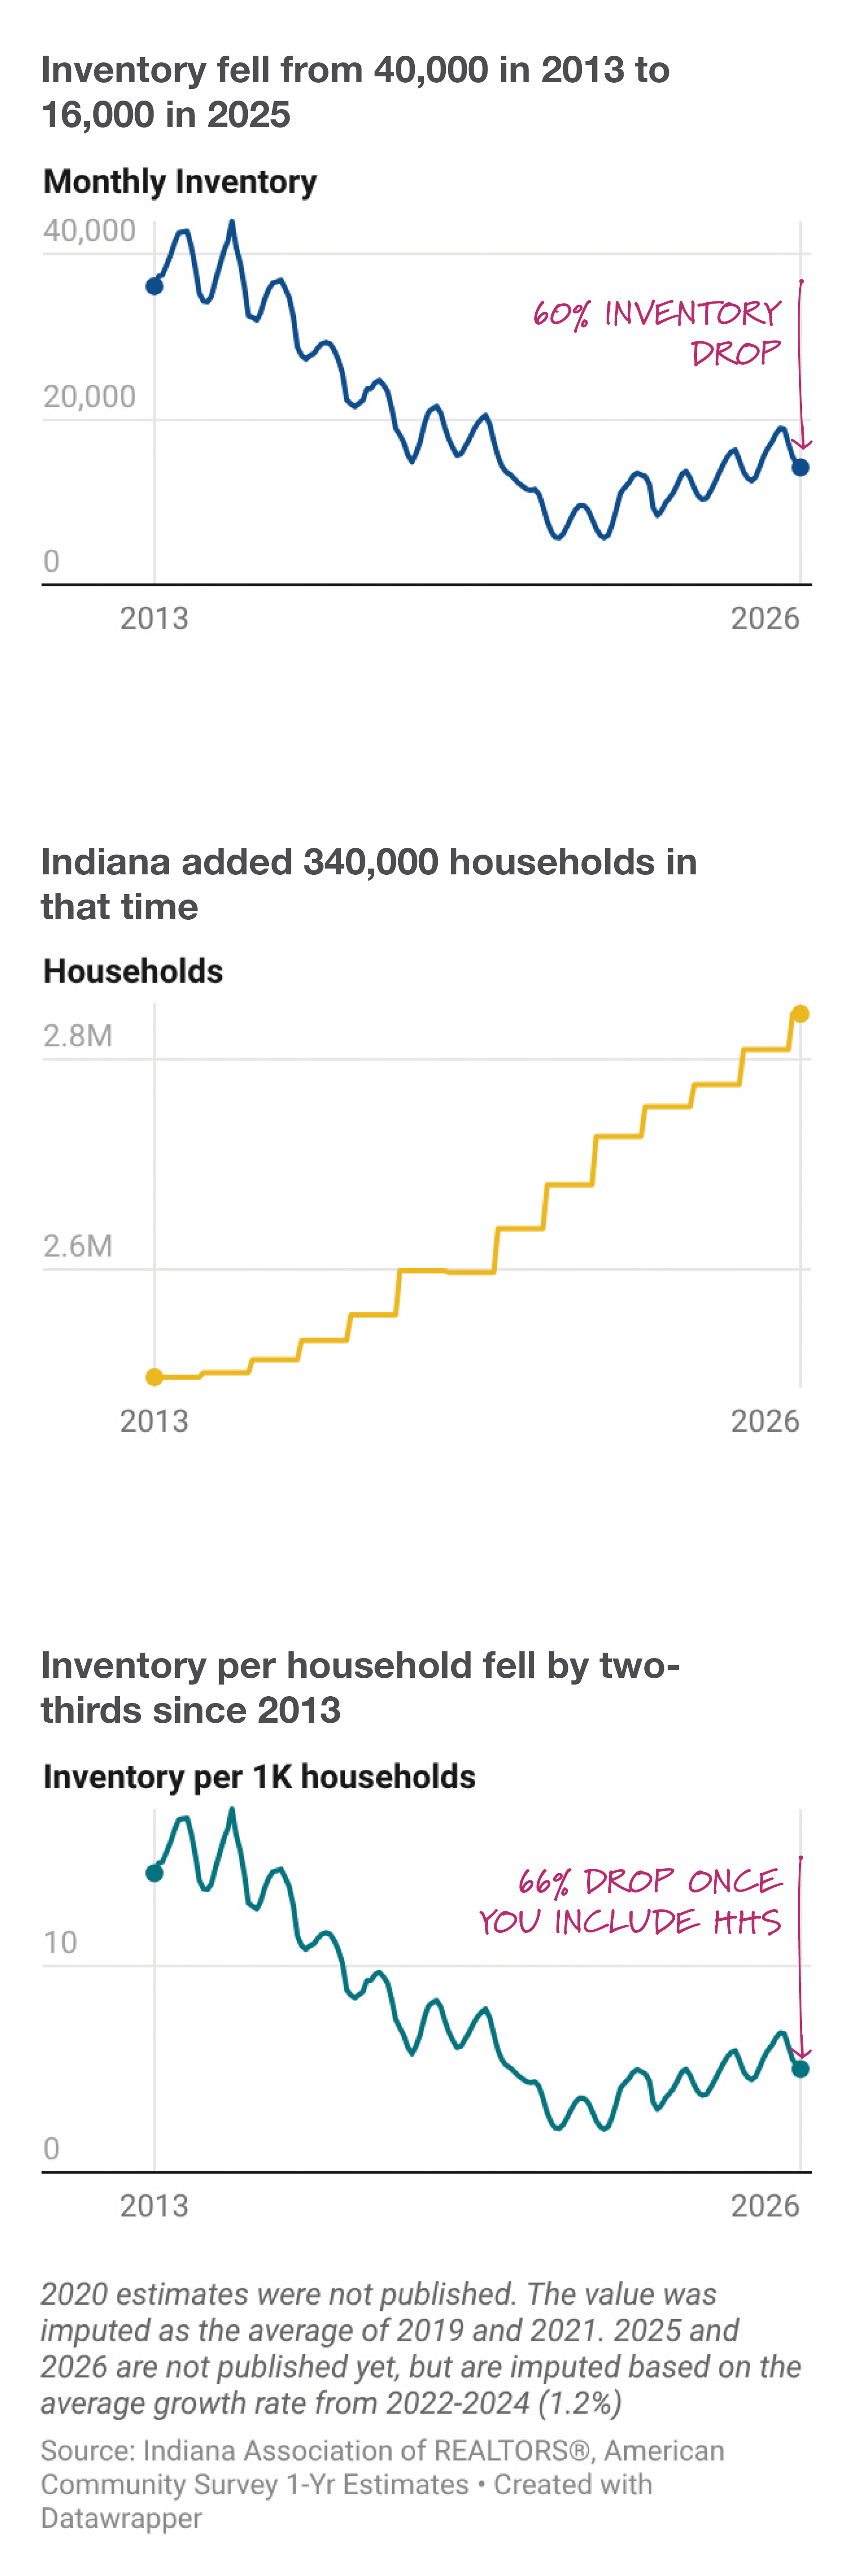
Indiana’s homeownership rate also increased slightly from 2016 (70.9%) to 2025 (71.4%); the number of Hoosiers is growing and we continue to pursue ownership even as it means competing over fewer MLS listings.
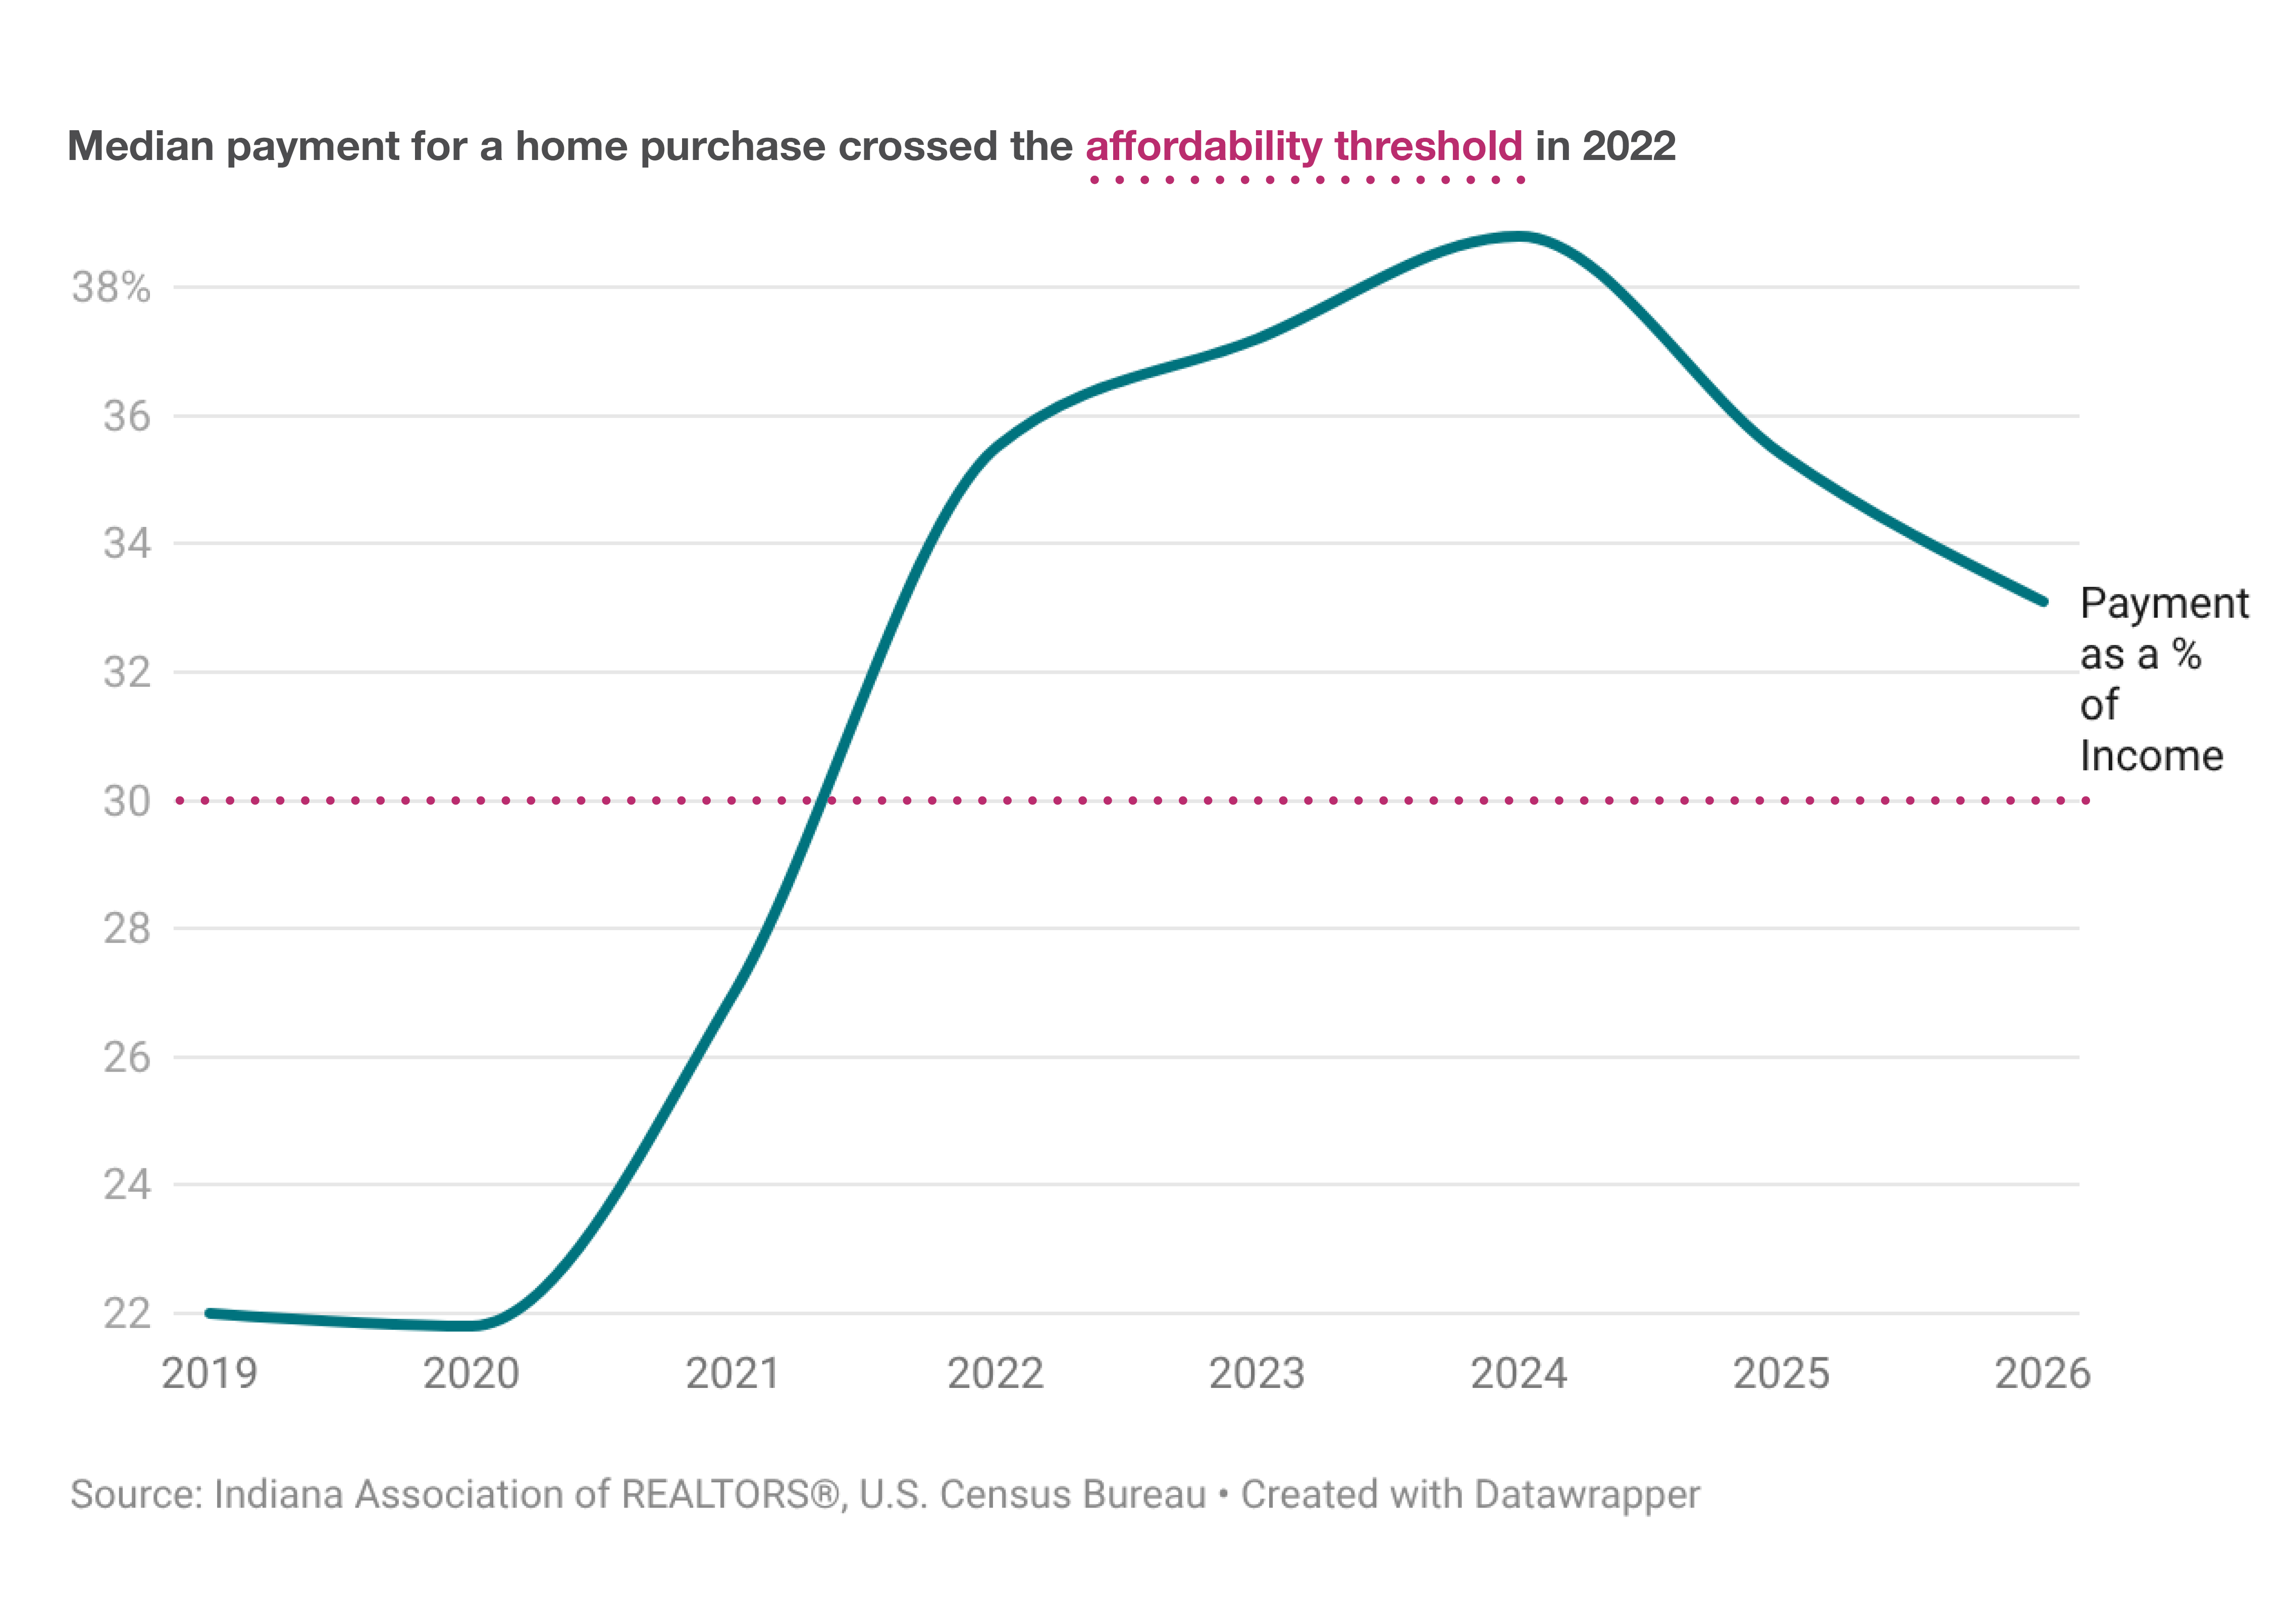
With supply and demand moving it opposite directions, access to owner-occupied housing is constrained and the impact on affordability is predictable:
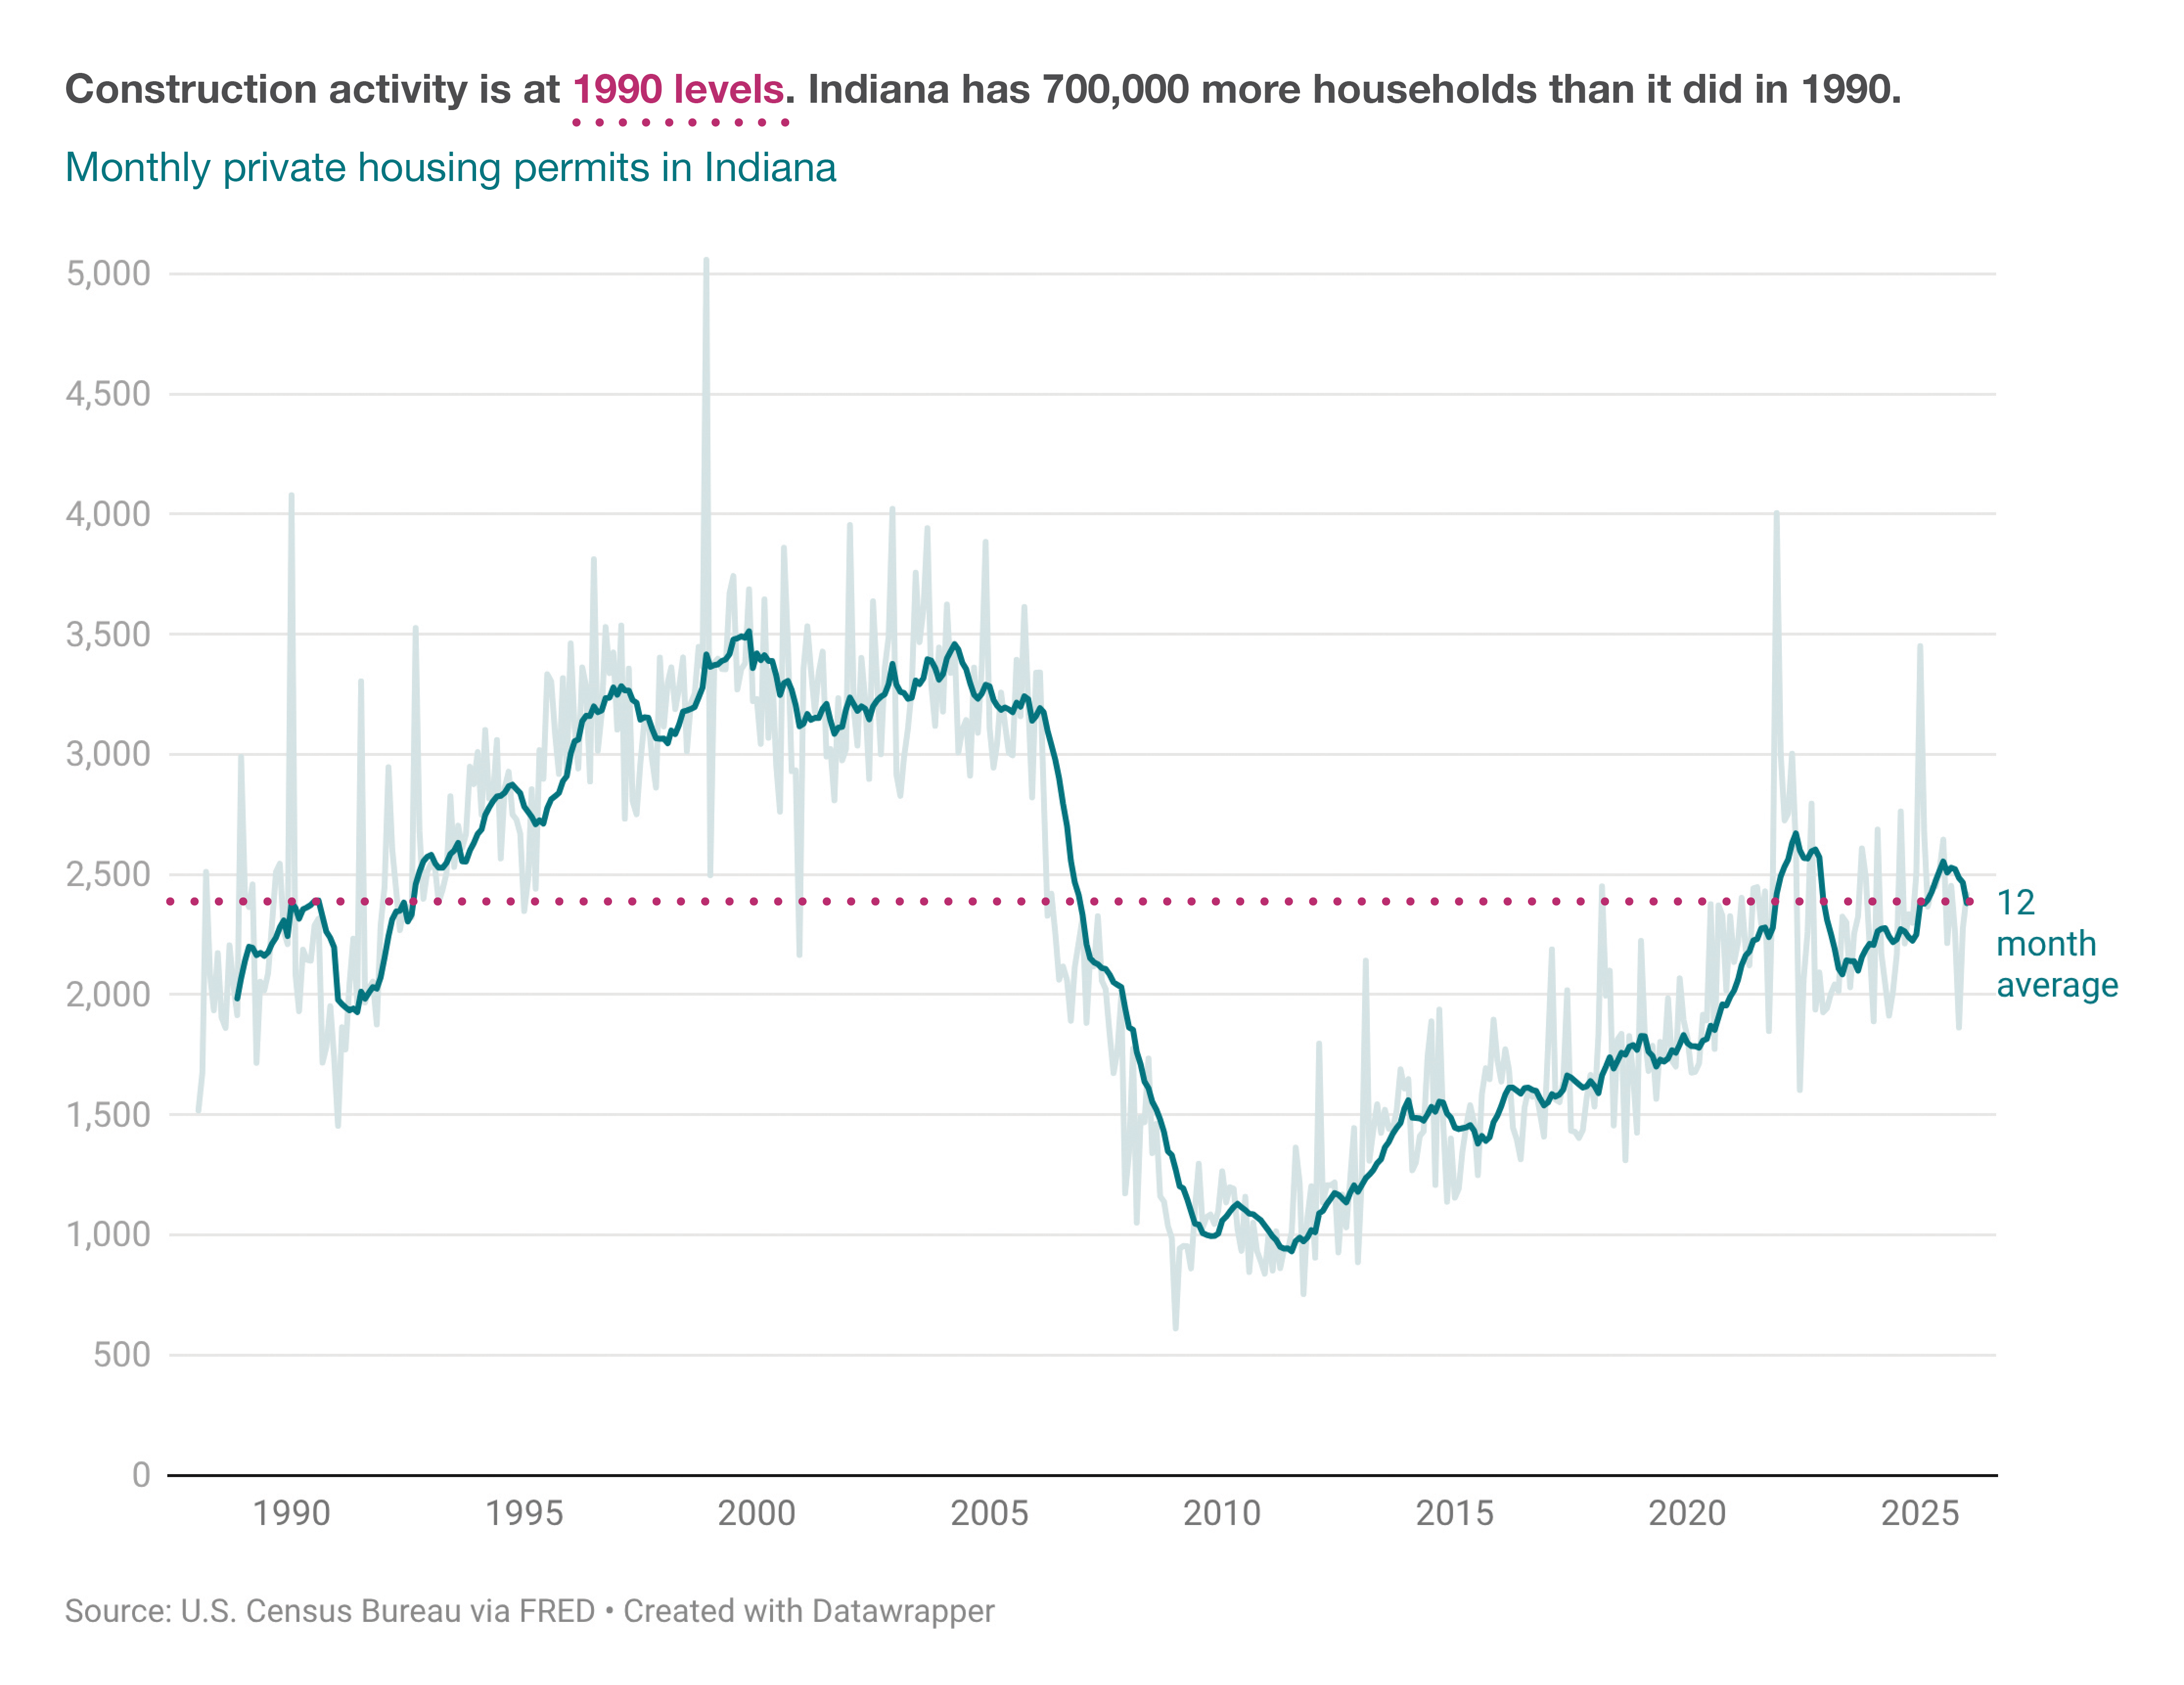
Residential construction statewide has never fully recovered from the Great Recession. Single-family building permits plummeted by two-thirds from pre-crisis norms (1997-2006) through the trough of the downturn (2008-2012) and remain 40% below that level through the past five years.
New construction has consistently made up 12-14% of our total MLS inventory in recent years and about 5% of new annual listings. These numbers have an accumulating impact over time; every existing home for sale was once an undeveloped or otherwise-occupied parcel.
The importance of new development is further magnified by the annual loss of thousands of units to dilapidation, disrepair or long-term vacancy. The median age since construction of an existing home in Indiana is fifty years, versus 46 for the national median age; nearly one in five homes were built before the end of World War II, a share 30% higher than the U.S.
Indiana’s housing shortage is a truly statewide challenge, with imbalances between household formation and new construction activity pervasive in rural, suburban and urban communities alike. State-level investments and policy solutions play a role in addressing housing deficits and easing affordability pressures.
However, housing inventory and underlying development trends play out differently across regions, localities, even neighborhoods; every real estate market is unique, even if they face some common supply-side issues.
This analysis assesses the anticipated housing shortage on a state level but also quantifies these shortfalls versus projected household growth on a regional and local basis. By publishing these projections, we hope to provide real estate professionals, local elected officials, housing advocates, economic developers and other stakeholders with a specific starting point for discussion, consensus-building and planning to scale residential development and supply to match baseline demand.
Indiana needs more homes. This report shows where, and by how much.
Indiana’s owner-occupied housing market is running a significant and growing deficit. The state needs approximately 192,500 new owner-occupied homes to be built between 2025 and 2029 to meet current and anticipated demand; this represents nearly double the pace of construction over the prior five years (2019-2024).
On a regional basis, this gap falls hardest on Central Indiana, which accounts for nearly half the statewide shortfall at 90,370 units, followed by the Northeast and Northwest Indiana regions. Pressure is also severe in smaller regions: East Central and Wabash River (West-Central) would each need to quadruple their recent permit pace just to meet demand. In 56 of Indiana’s 92 counties, vacancy is already below 1 percent, a level below which limited supply tends to constrain market activity, and construction is insufficient. In only five counties is the current pace of building adequate to match demand.
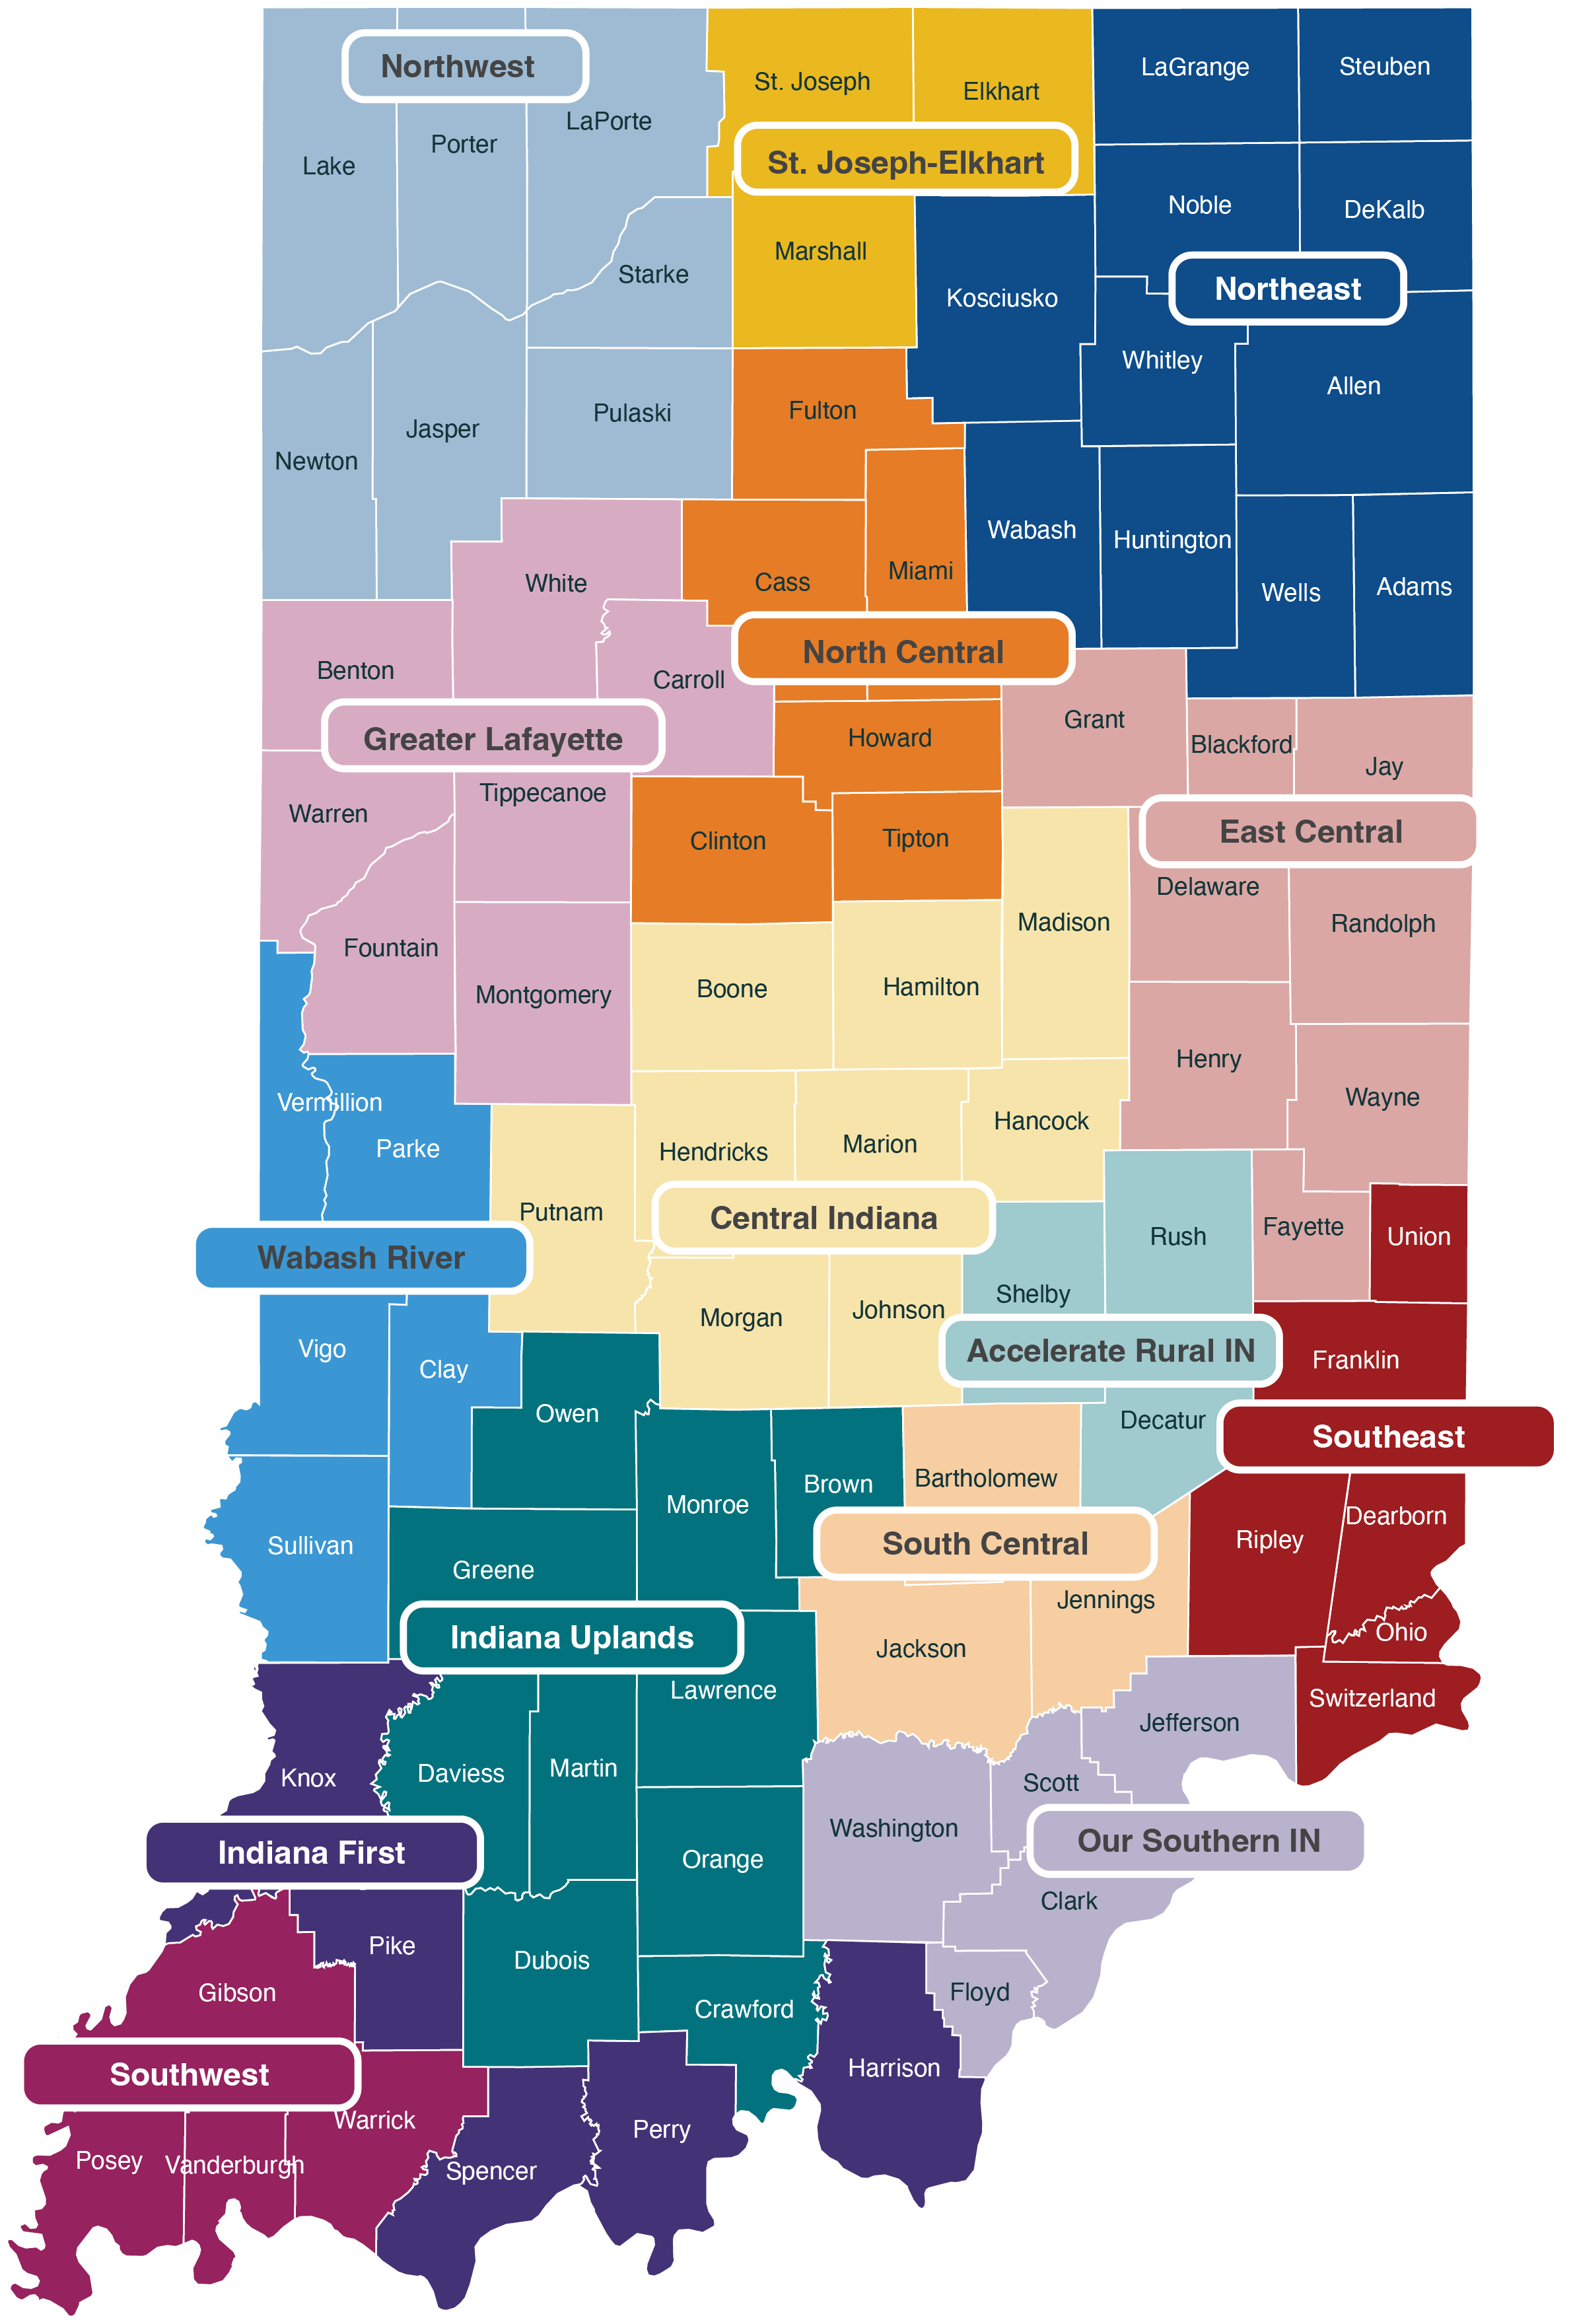
The companion dashboard provides supply gap estimates, household growth forecasts, construction trends, and vacancy data for Indiana, all 92 counties, the state’s 21 local REALTOR® associations and the 15 regions designated under Indiana’s Regional Economic Acceleration and Development Initiative (READI) program.
Download your housing study
Understand Your County's Housing Needs
Housing needs dashboard for every county and region, downloadable and shareable.
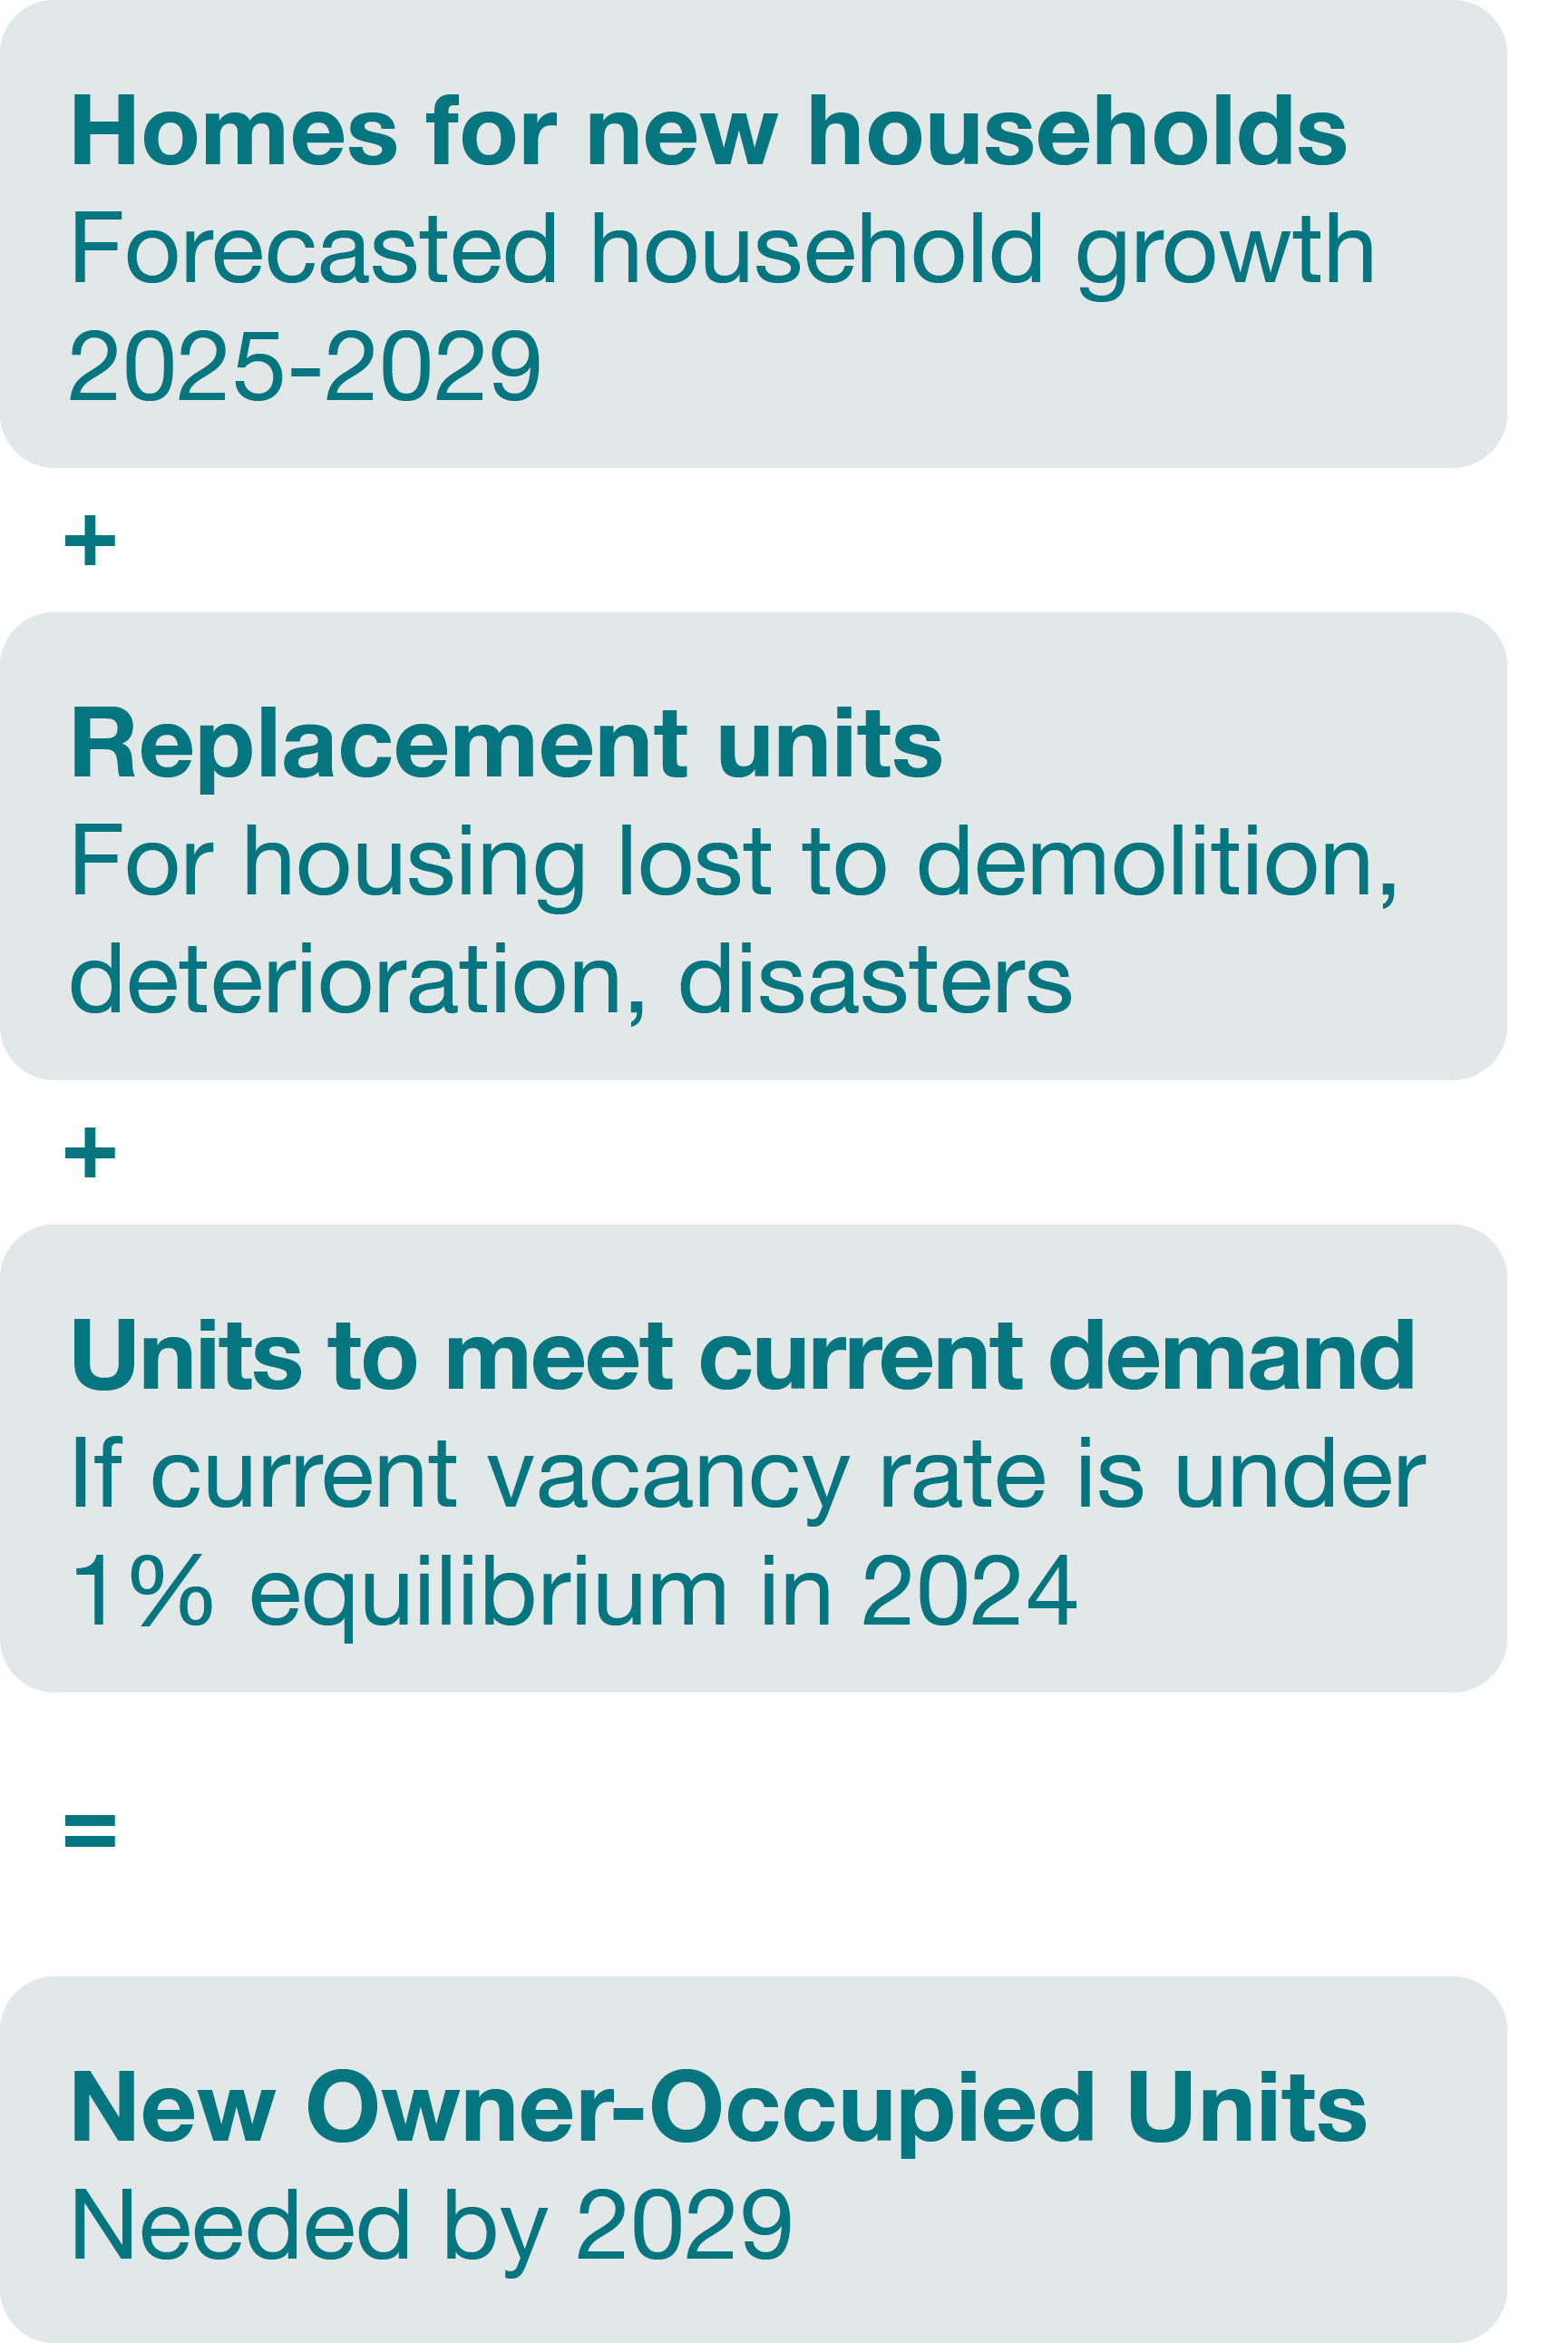
We estimate Indiana will need 192,500 new owner-occupied homes by 2030. This statewide supply need has three components: First, homes for new households – the market must have enough supply to accommodate the new households projected to form over the next five years. Second, replacement units for existing homes that are lost every year to demolition, deterioration, and conversion; new construction is needed just to keep pace with those losses even where populations are flat. Third, restoring healthy vacancy: A functioning market needs a small share of owner-occupied homes immediately available for sale at any time (1 percent for the purposes of our owner-occupied projections). When this buffer falls too low, buyers have fewer choices, prices rise, and new households that would otherwise form cannot find a home to purchase.
This doesn’t mean inventory cannot be limited above 1 percent due to more intense demand and other market forces. We have seen declining supply affect home price appreciation even at sufficient vacancy levels; however, assessing the impact on prospective homebuyers who defer their decisions to move or broaden their search to more affordable areas would call for a more speculative analysis.
To calculate the supply gap, we add these three pieces. Current vacancy rates tell us we need more supply just to meet demand right now, or if there is excess supply that can absorb future demand. We add to that projections of household growth and the need for housing replacement to find the total need for new construction.
New construction will meet some of this supply need, but we need to increase our pace of construction to keep up with demand. Over the past five years (2019-2024) counties in Indiana permitted nearly 100,000 single-family units. This rate needs to almost double to meet the projected need. It is also relevant to note that even the 2019-2024 period saw construction rise more than 35 percent from the previous period, during which new development was still slowly recovering from the trough of the Great Recession.
Indiana has 260,000 vacant housing units, 9 percent of all units, but only 64,000 are actually listed for sale or rent. The other 194,000 are off the market for various reasons and not available to a buyer. They include seasonal cabins and lake homes, properties in foreclosure, abandoned homes, units held for personal reasons, and homes already under contract but not yet occupied.
There has been recent commentary suggesting that vacant (largely abandoned) units should be factored into any housing shortage calculations as durable physical assets; however, units that are not occupied or available, or even habitable in current condition, are not considered part of our active owner-occupied market.
Could these units be brought back into the market? Yes, this number fluctuates, and more demand for owner-occupied housing could bring units out of long-term vacancy to meet that demand. However, most would likely need a lot of work to meet the needs of current homebuyers, and therefore we are back square one: We need to increase investment in housing construction, remove regulatory roadblocks, and encourage creative, affordable housing paradigms.
The vacancy rate that matters most for homebuyers is: homes that are vacant and for sale as a share of the total owner-occupied market. That is the number that reflects whether buyers have homes to choose from. By that measure, Indiana’s statewide owner vacancy rate is 0.83 percent, according to the 2024 ACS five-year estimate.
We use a vacancy equilibrium of 1 percent for owner-occupied units and 5 percent for rental. These are standard industry benchmarks, and they are consistent with Indiana’s own recent history outside of crisis years. According to American Community Survey one-year estimates, the state’s for-sale vacancy rate was 1.3 percent in 2018 and 2.0 percent in 2013, a period when post-recession elevated vacancy was still working its way through the market. By 2023 it had fallen to 0.8 percent, indicating a market that had tightened well below equilibrium. (American Community Survey One-Year Estimate)
Note: Vacancy is calculated as vacant-for-sale units as a share of the owner market (owner-occupied plus vacant-for-sale plus sold-not-yet-occupied). See https://www.census.gov/housing/hvs/definitions.pdf for definitions of vacancy categories.
Household formation forecasts are generated by a county-level statistical model that looks at home prices, sales activity, recent household growth trends, employment, and migration patterns, and asks what those conditions have historically produced five years later. Before using the model to forecast the future, we tested it against five years of actual outcomes it had never seen, covering all 92 Indiana counties across five independent test windows.
The owner-occupied model is the stronger of the two models estimated; the renter model performs well but with greater variability.
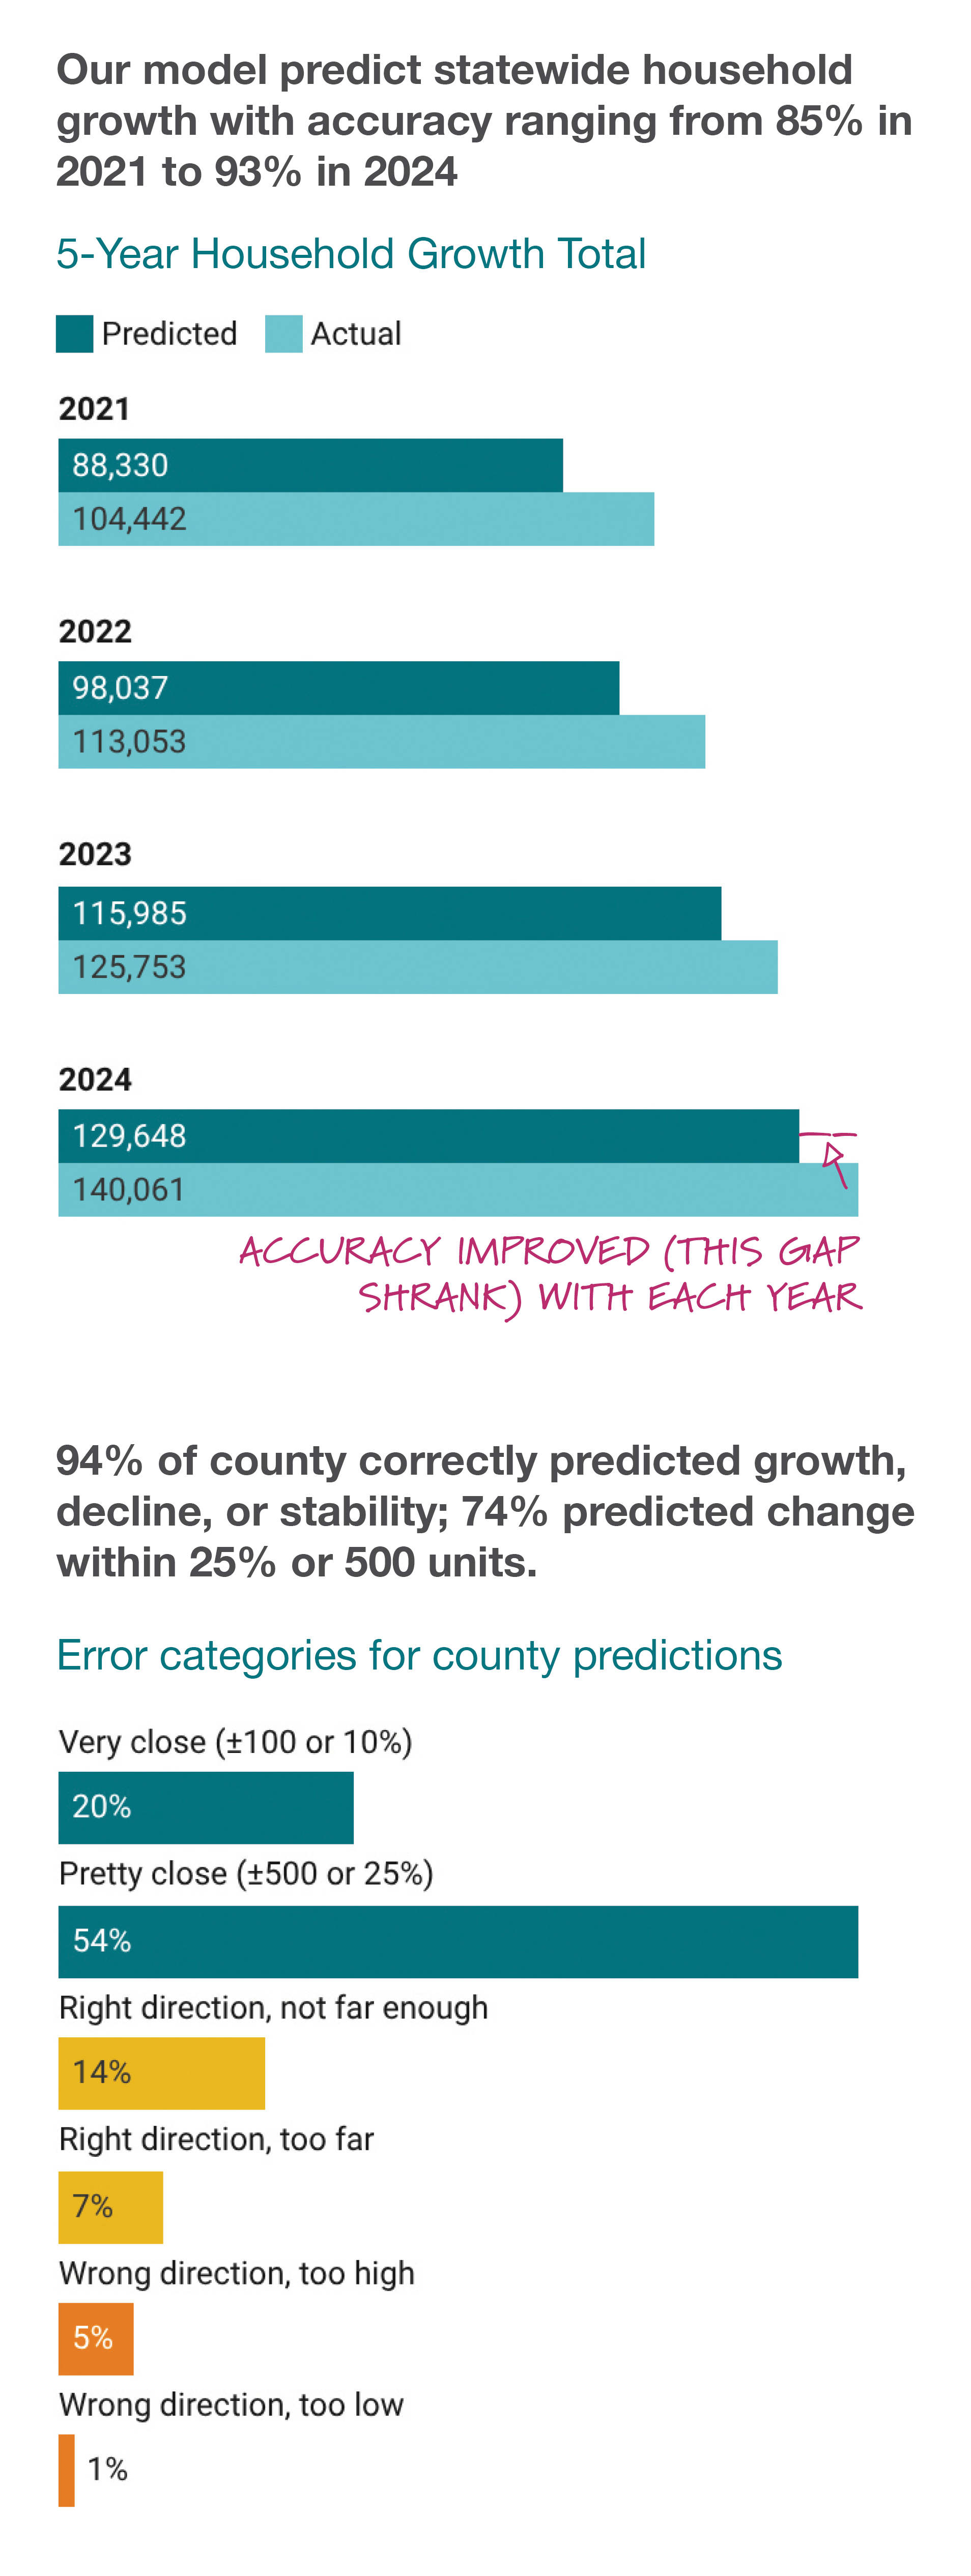
The forecasts incorporate migration patterns through 2024. International migration has been a meaningful driver of household growth, but future migration is uncertain due to federal immigration policy and enforcement.
However, this model is validated using past migration data to forecast future household growth. We do know past migration trends, and people that have already arrived here represent present demand on the housing market.
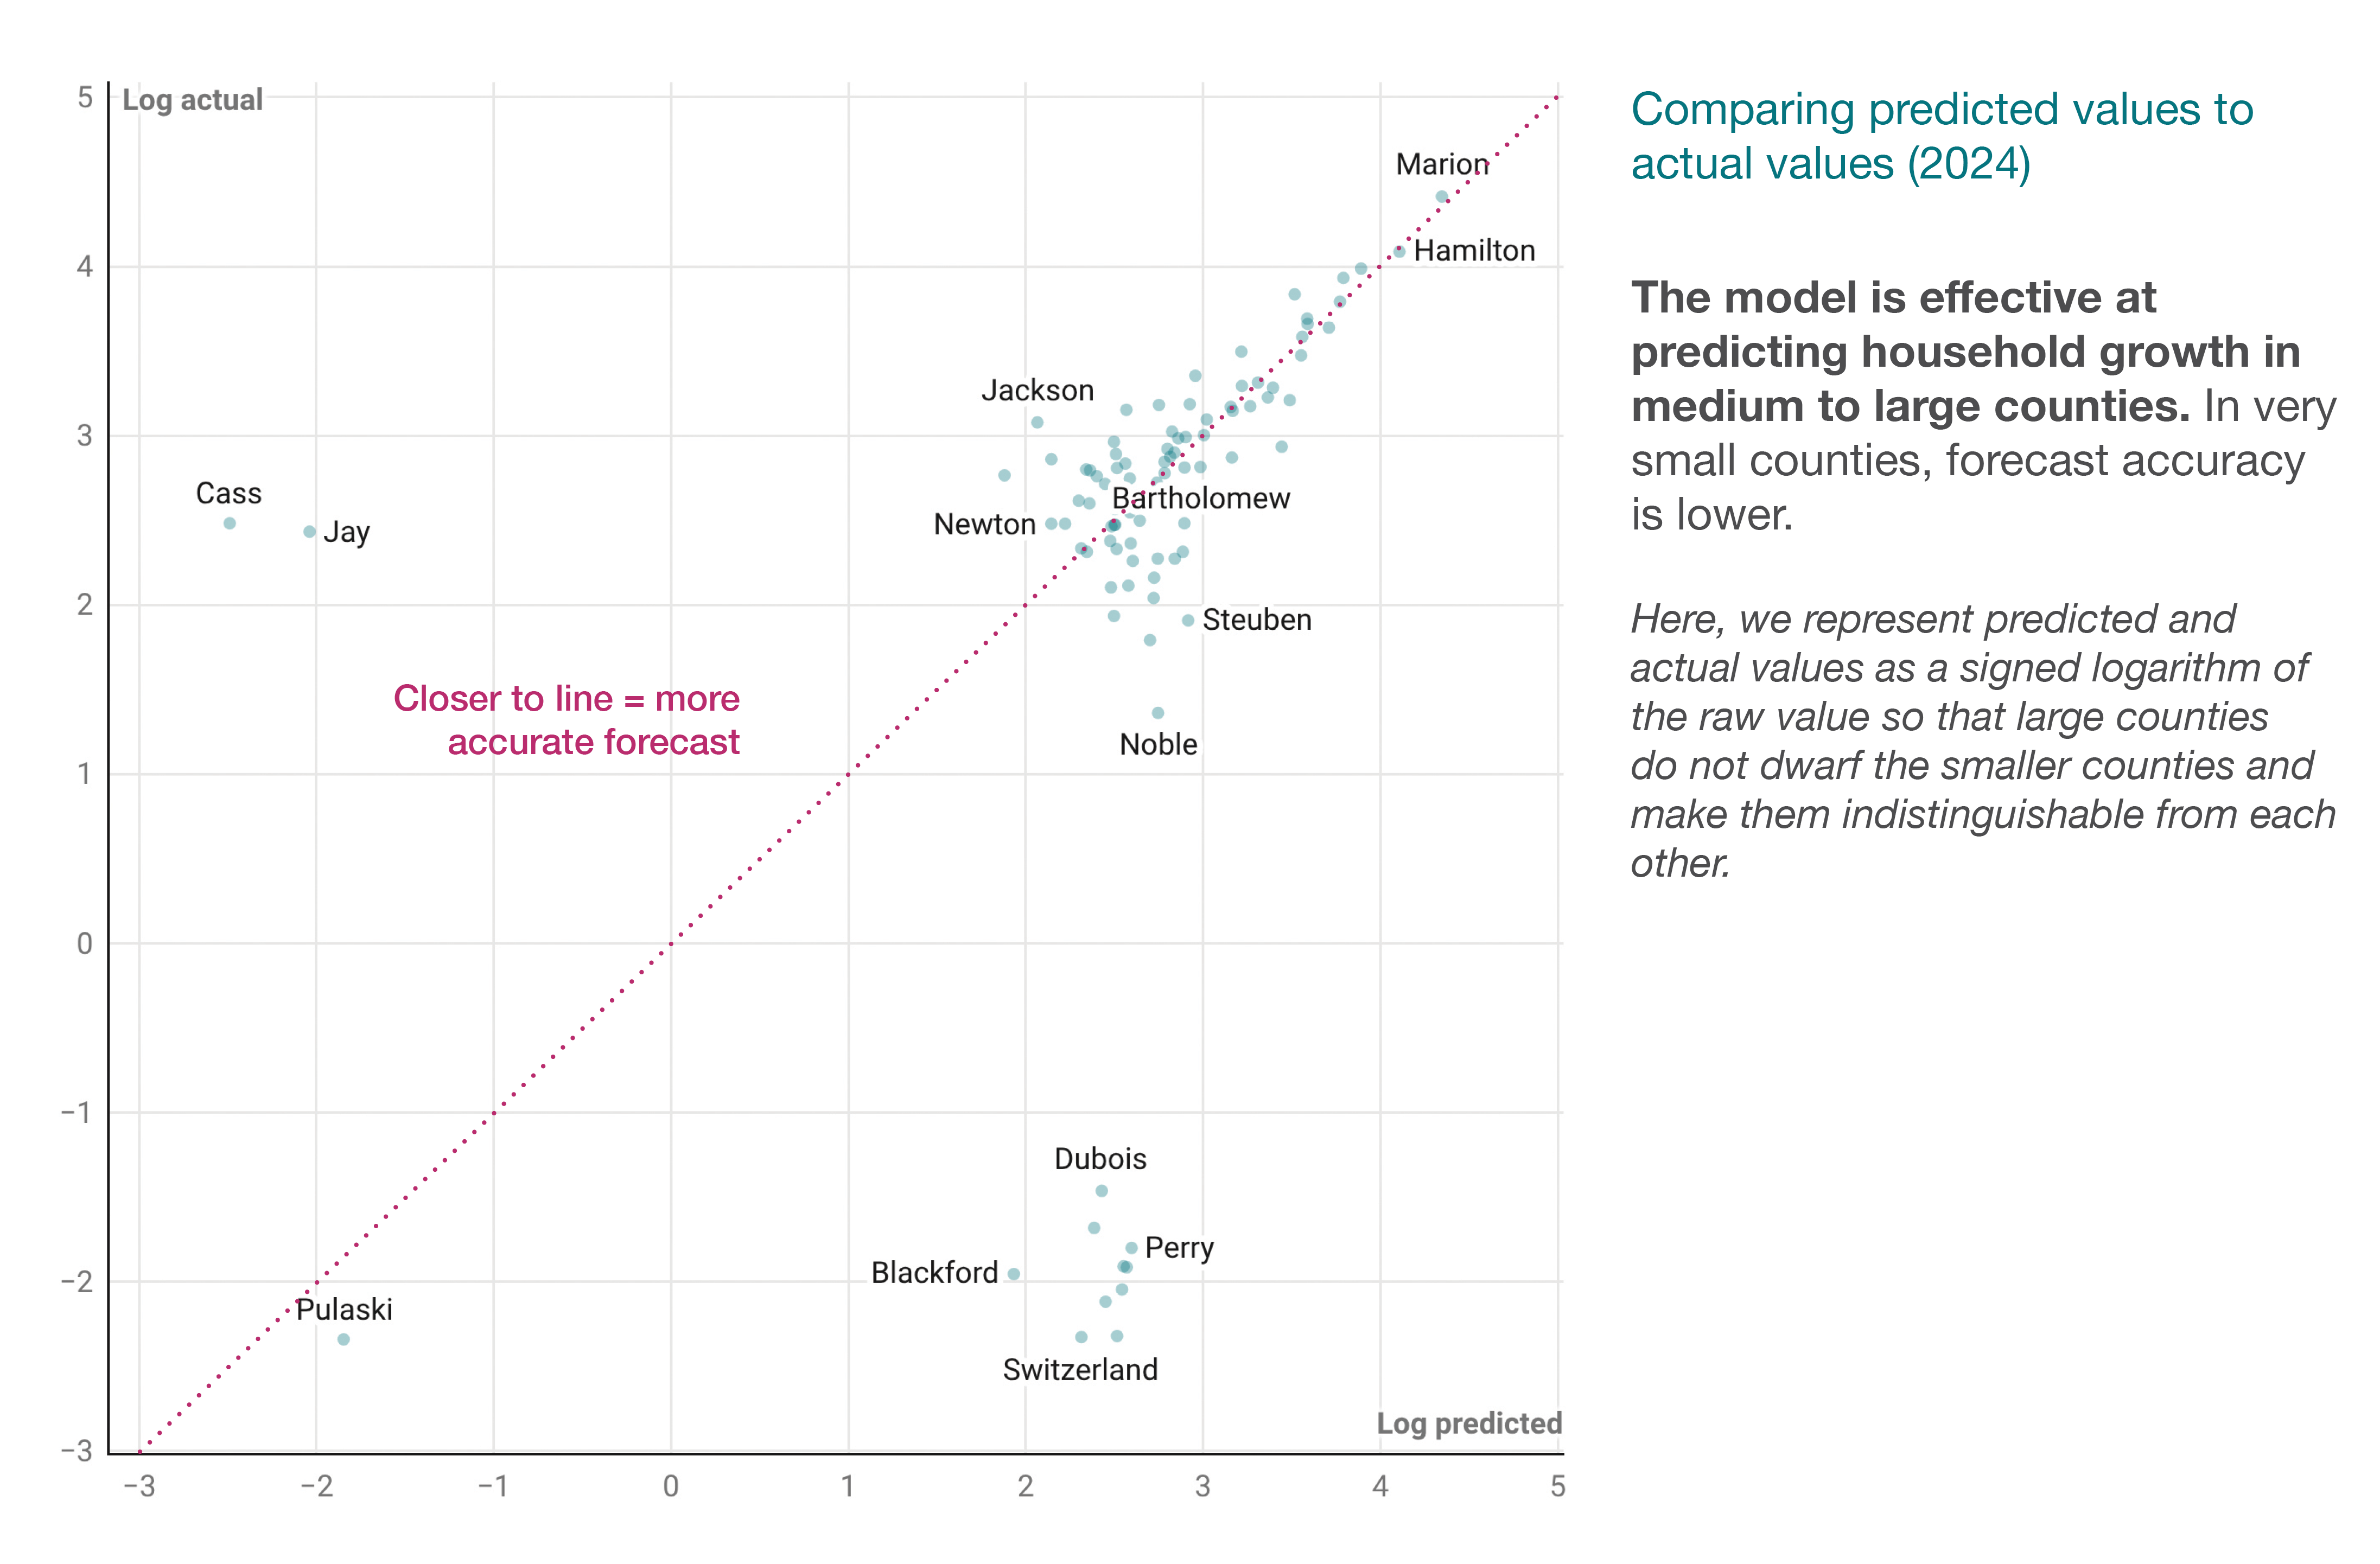
The model also does not account for sudden economic or employment disruptions. It is weaker for smaller counties with high variability.
Full validation results and technical documentation are available at: data.indianarealtors.com/housing/method.
Indiana’s owner-occupied housing market faces a substantial supply gap heading into the second half of the decade: As stated previously, the state needs an estimated 192,500 new owner-occupied units between 2025 and 2029. That figure accounts for projected household formation, the anticipated loss of aging housing stock, and the need to restore a functional level of market vacancy. Over the prior five-year period, roughly 100,000 owner permits were pulled statewide. To meet projected demand, the construction pace would need to nearly double.
The demand projection itself reflects a moderating trend. Indiana added approximately 140,000 owner-occupied households between 2019 and 2024, more than three times the 45,000 added in the prior five-year period. The forecast for 2025 to 2029 projects roughly 172,000 new owner households: continued growth, but at a pace that represents a settling rather than a further acceleration.
The statewide owner vacancy rate, measured as homes actively listed for sale as a share of the total owner market, sits at 0.83 percent. Nearly 19,500 vacant-for-sale units would be needed to reach the 1 percent equilibrium threshold, against a current deficit of roughly 3,300 units. The county-level analysis below examines how these conditions vary across Indiana’s 92 counties.
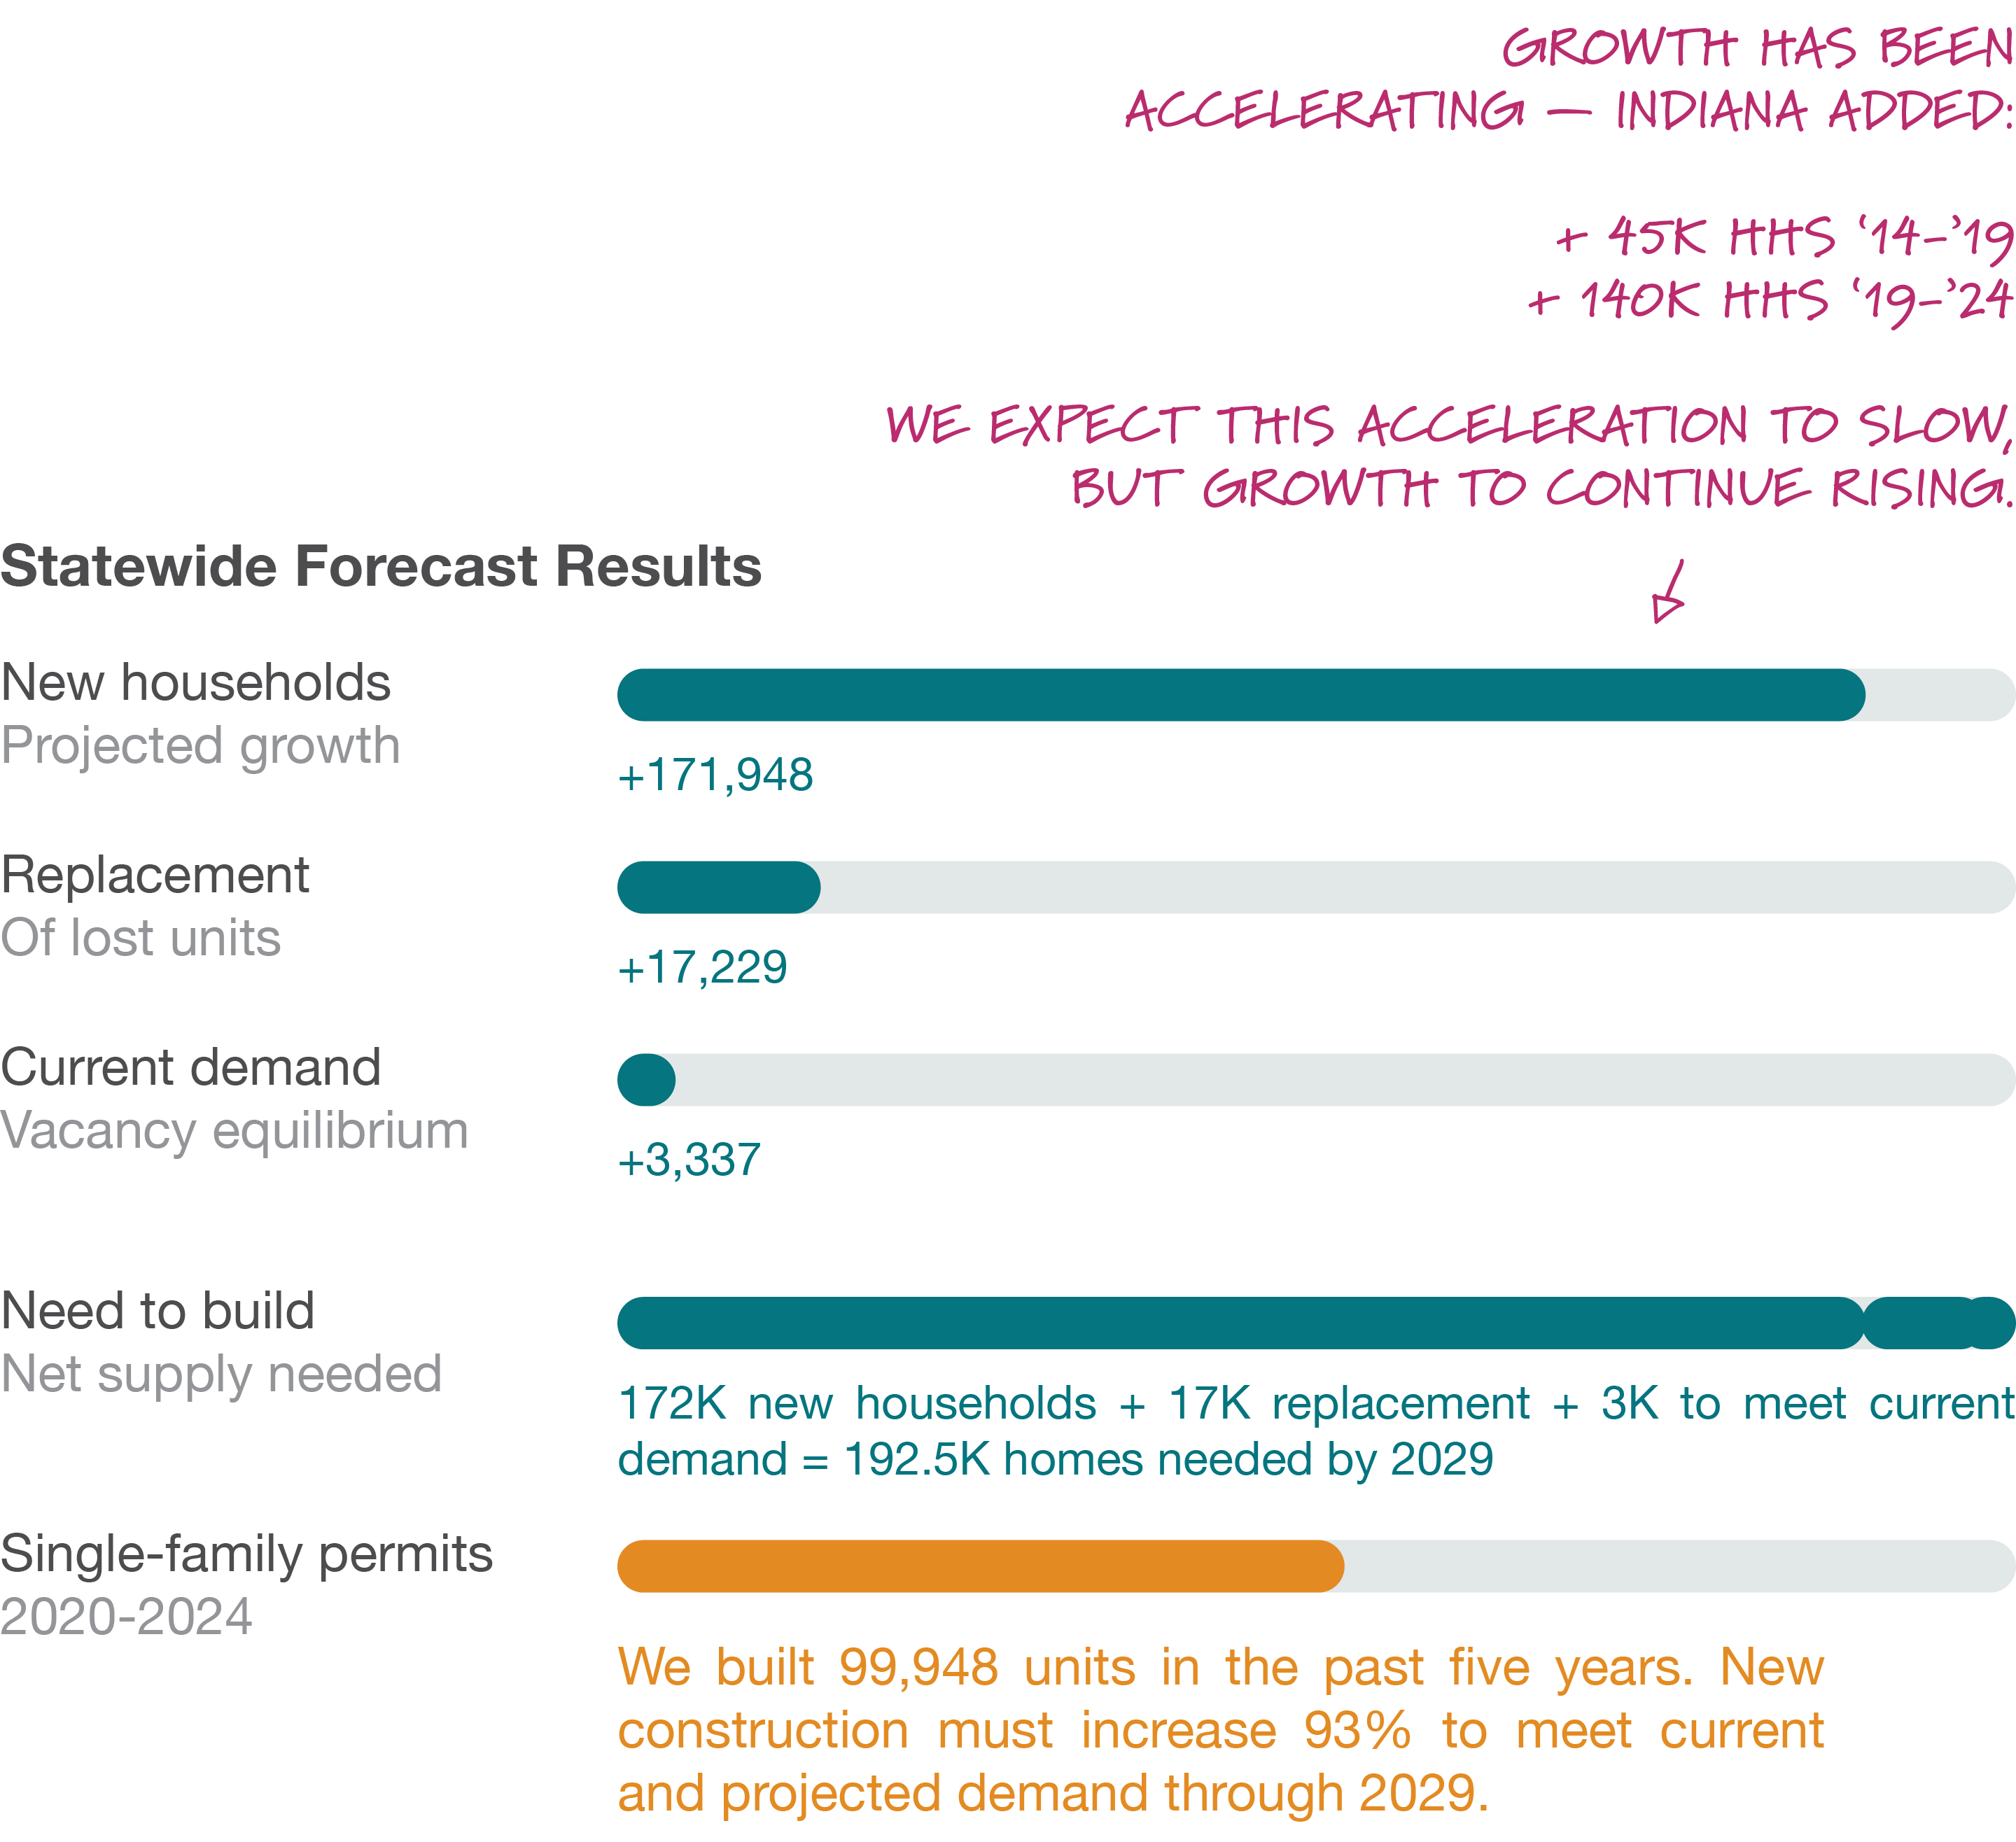
The statewide owner vacancy rate, measured as homes actively listed for sale as a share of the total owner market, sits at 0.83 percent. Nearly 19,500 vacant-for-sale units would be needed to reach the 1 percent equilibrium threshold, against a current deficit of roughly 3,300 units. The county-level analysis below examines how these conditions vary across Indiana’s 92 counties.
Map: Construction needs are highest in Northwestern and Central Indiana. Only 11 counties have sufficient or excess construction compared to our forecast.
Indiana’s 92 counties do not face the same housing challenge. The county-level data reveal four distinct market conditions, defined by the tightness of current vacancy and whether the recent pace of construction is sufficient to meet projected demand. For detailed data on any individual county, see the companion dashboard at data.indianarealtors.com/housing.
Tight vacancy: construction must increase
56 counties
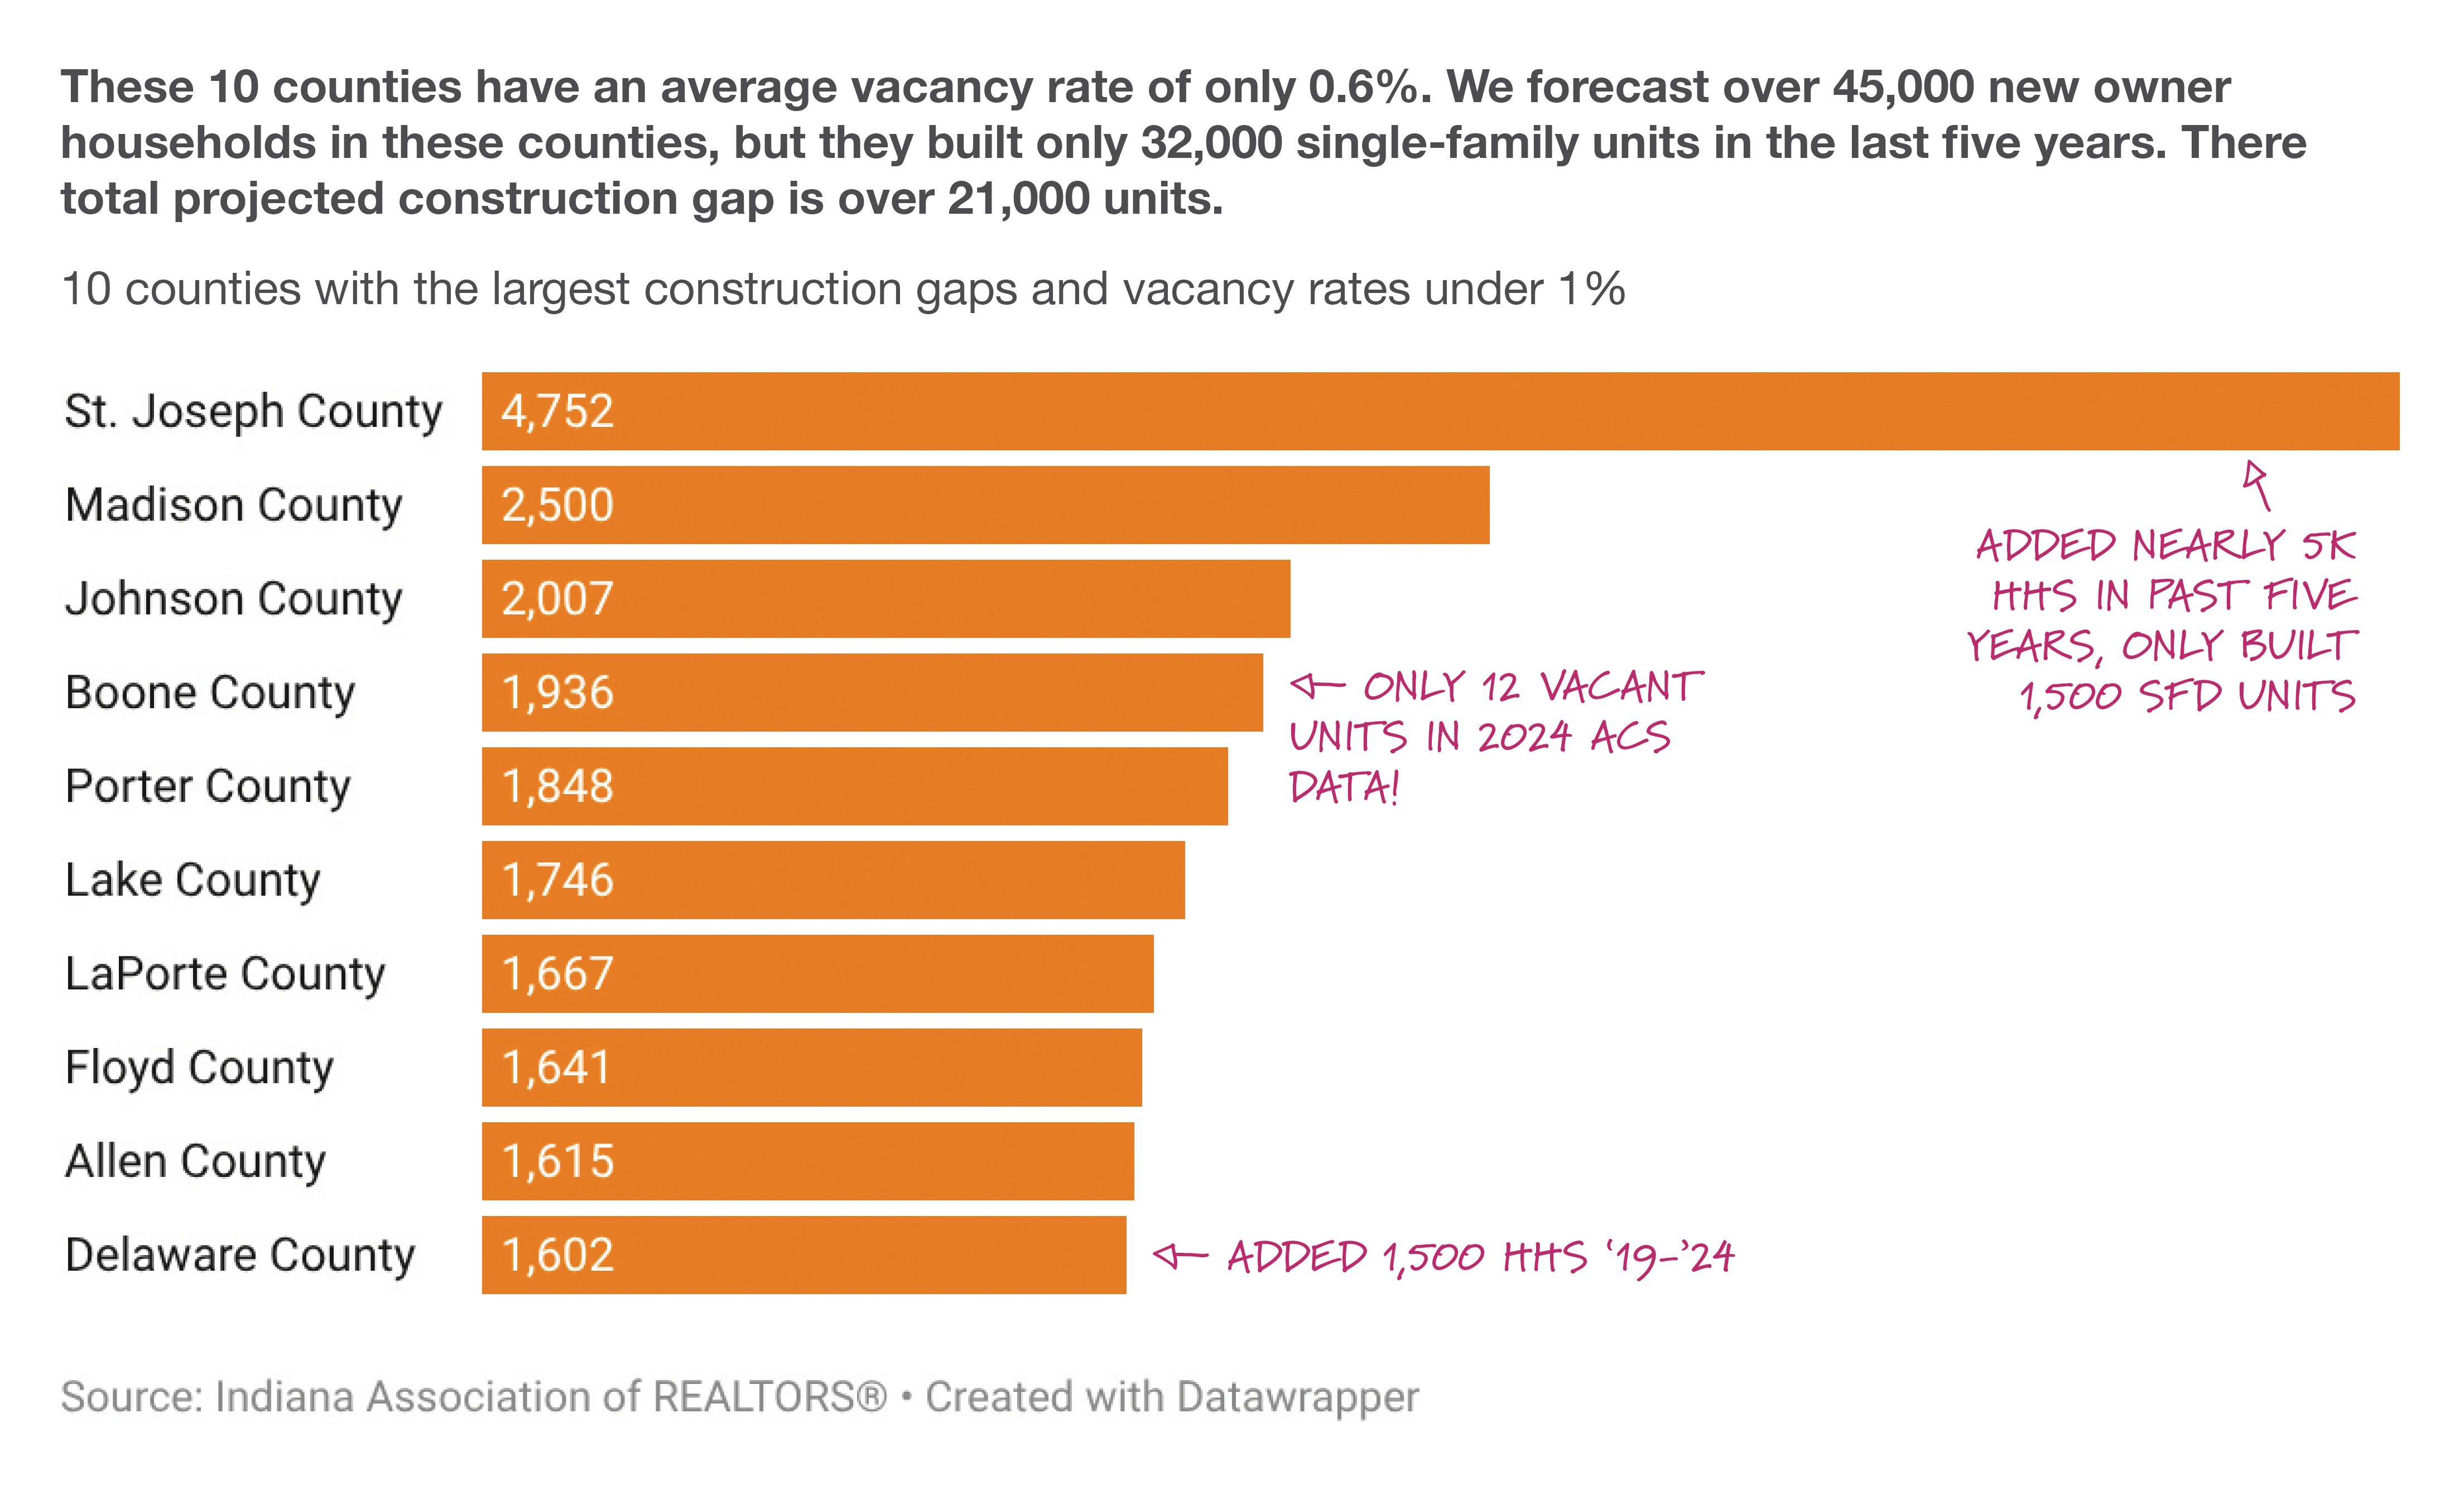
In 56 of Indiana’s 92 counties, the owner-occupied housing market is both running short on available inventory now and projected to have demand outpace supply in the future. Owner vacancy rates in these counties fall below 1 percent, and the pace of recent construction has not been sufficient to meet projected supply need through 2029. The median county in this group would need to roughly double its permit rate to close the gap. The largest absolute shortfalls are concentrated in fast-growing urbanized counties, including St. Joseph (4,752 units), Johnson (2,007), Boone (1,936), and Porter (1,848), but the problem is structural across much of the state, including in mid-sized markets such as Madison, Delaware, and Howard counties.
Vacancy is sufficient, construction must increase
25 counties
Twenty-five counties enter the forecast period with owner vacancy rates at or above 1 percent, meaning the existing stock offers some buffer. However, this buffer does not eliminate the need to accelerate new construction: Projected household formation through 2029 is large enough that permits must increase to prevent the current vacancy cushion from being absorbed entirely.
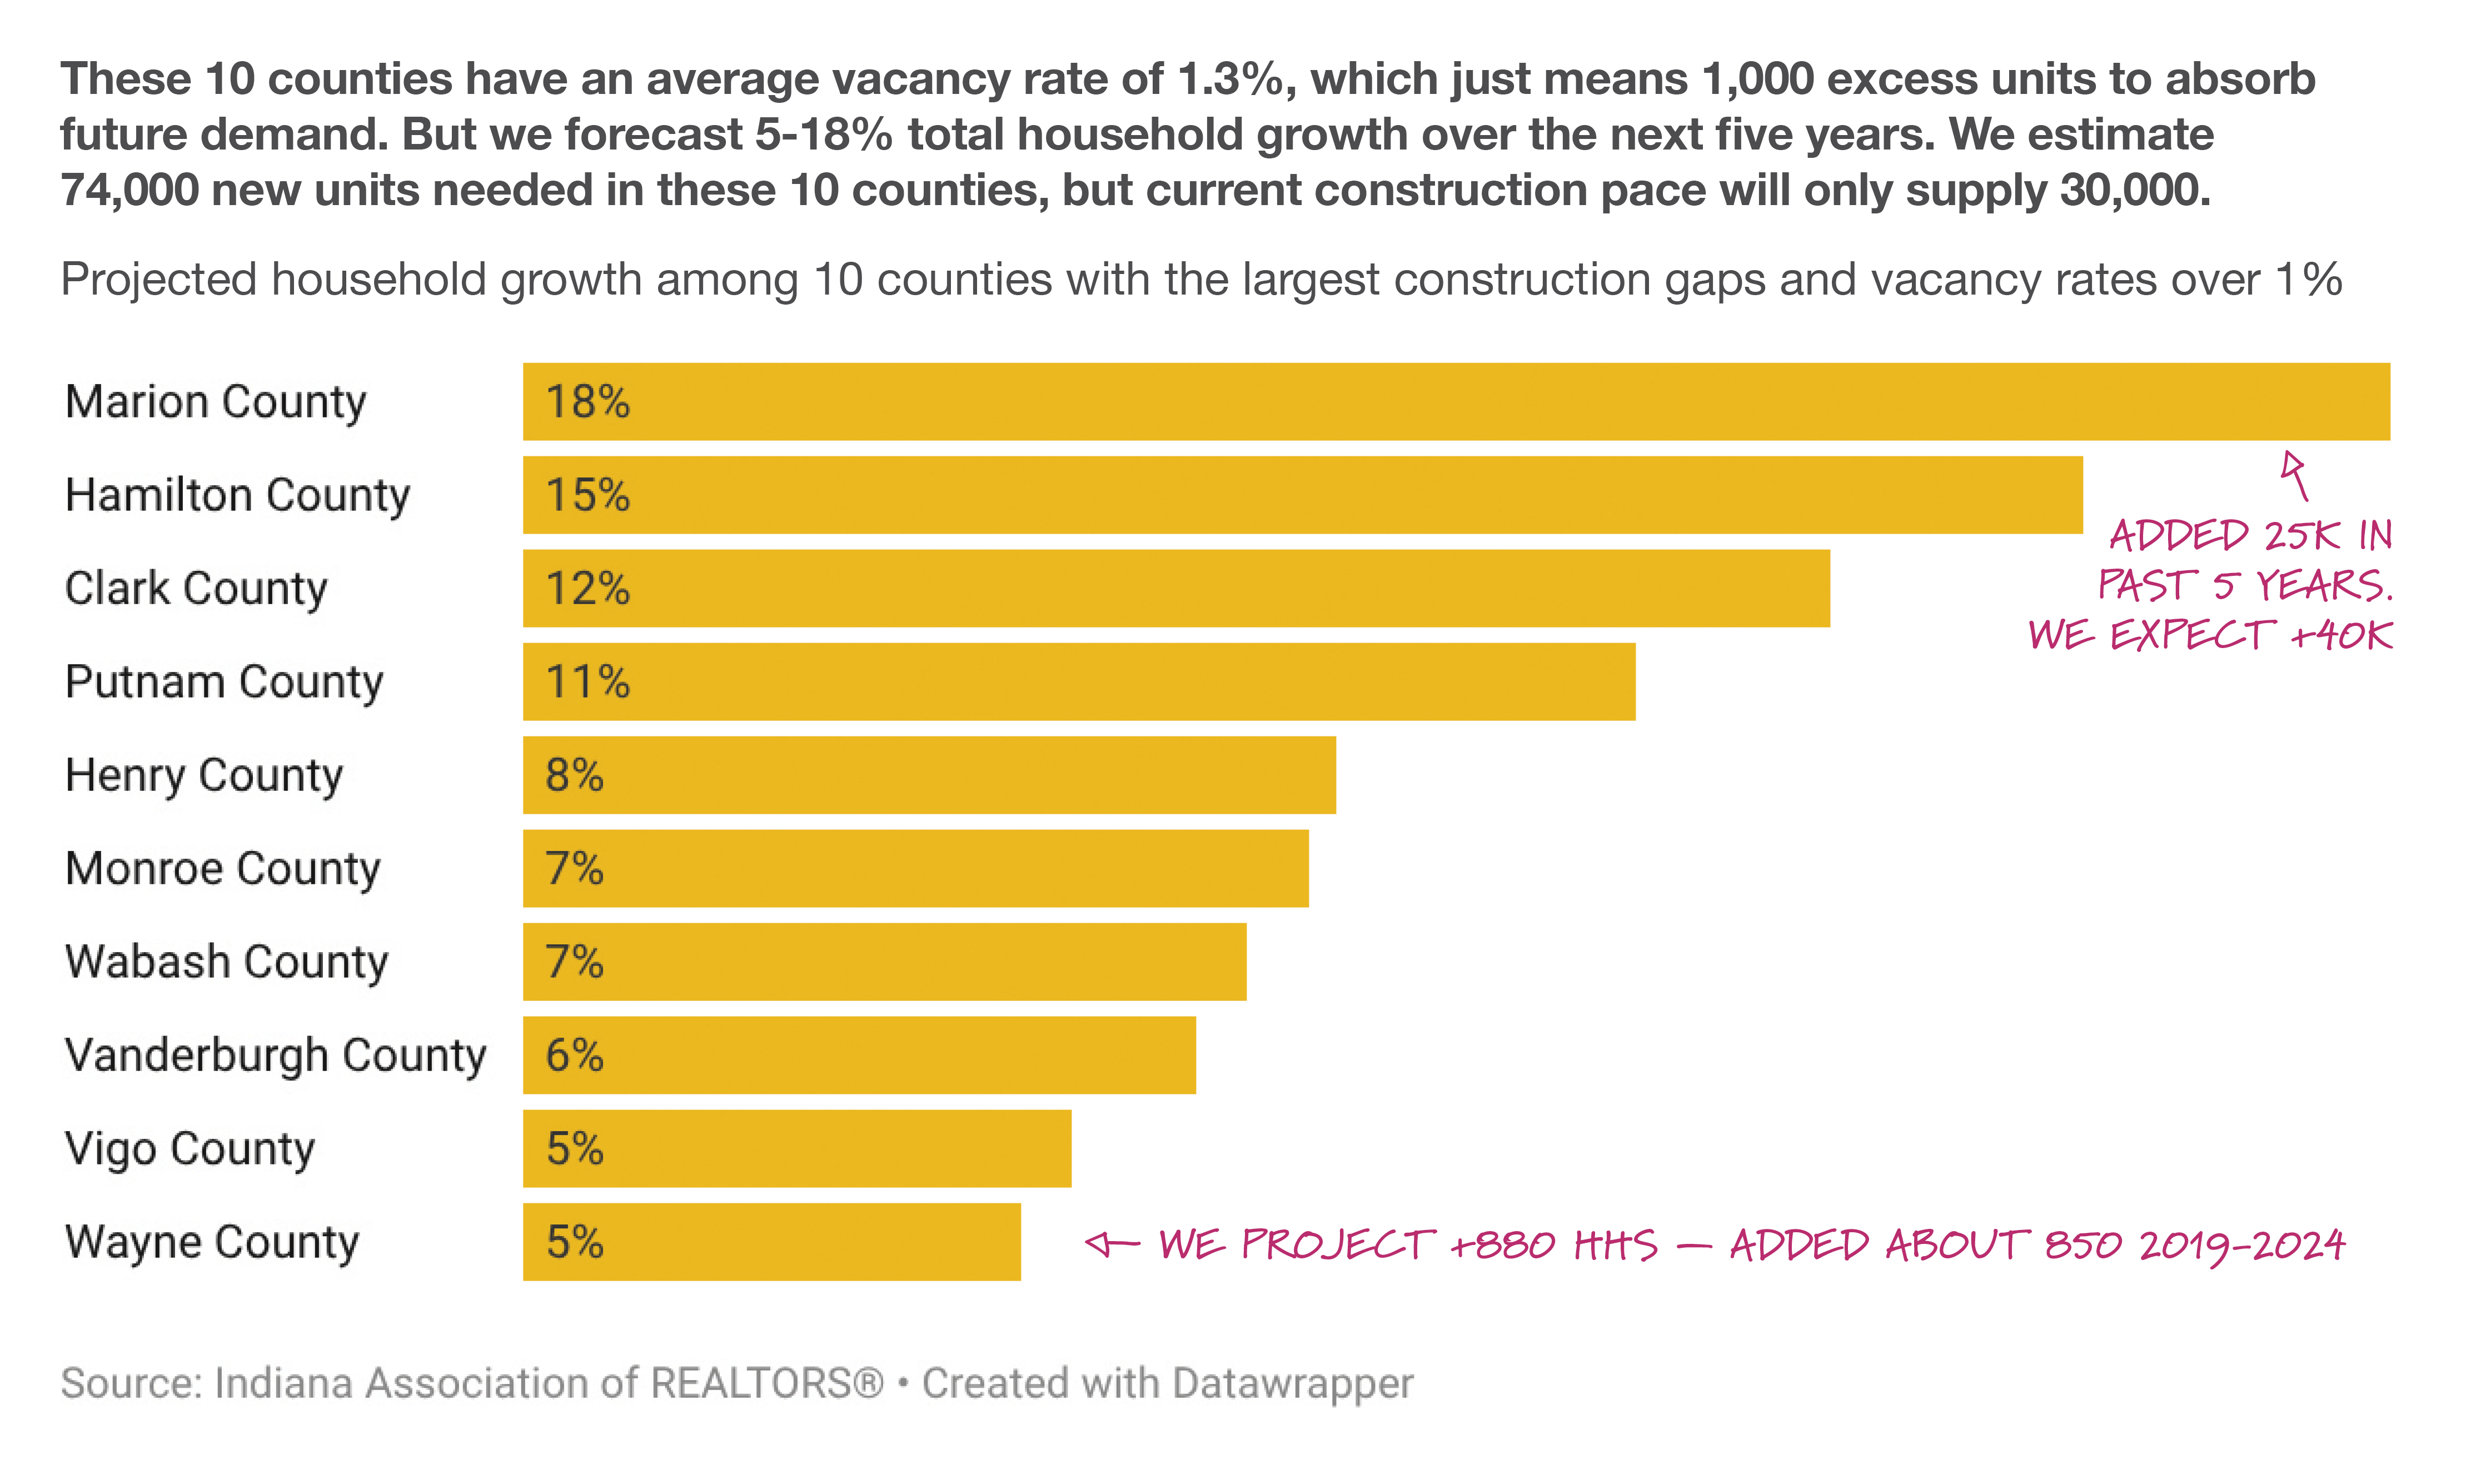
Vigo County is part of this cohort: With a vacancy rate of 1.6 percent, it has 150 units that can absorb new demand. However, that will not even cover the 280 units we project will fall out of inventory and need replacement over five years, let alone accommodate the more 1,300 new households we forecast. Fewer than 300 new homes were permitted in the last five years, not enough to keep up with projected needs. Similar dynamics play out in other populous counties like Monroe, Clark, Vanderburgh, and Marion.
Current construction is sufficient
5 counties
Five counties, Adams, Cass, Clinton, Dubois, and White, are building at a pace that meets or exceeds projected owner household demand through 2029. In each case, permits pulled between 2019 and 2024 are sufficient to cover the modeled five-year need. These counties are not without housing concerns, several carry vacancy rates below the 1 percent threshold, but on the narrow question of whether recent construction activity could meet anticipated demand, the answer is yes.
Overbuilding risk
6 counties
In six counties, recent construction activity relative to projected demand warrants scrutiny. The concern takes two forms. In Starke, LaGrange, Newton, and Noble counties, vacancy rates are already elevated and permit totals outpace the demand forecast, a combination that points toward excess supply rather than shortage. In Daviess and Jackson counties the dynamic is different: the model projects a slight contraction in owner households through 2029, meaning recent permits were already building ahead of where demand is headed. None of these markets show the scale of overbuilding that would suggest a sharp correction, but each merits monitoring.
Indiana’s Regional Economic Acceleration and Development Initiative (READI) program dedicated $1.25 billion through two rounds of state funding to regional partnerships focused on quality of life and place-making priorities, housing and neighborhood development, workforce and other capacity-building efforts focused on economic growth and community vitality.
READI funding has been a significant source of support for new housing projects across Indiana and has also encouraged a more active role for Regional Development Authorities (RDAs) overseeing deployment and implementation. As these RDAs, local stakeholders and state policymakers consider future plans, we want to ensure housing needs are documented within these ‘functional’ regions.
 Where are current shortfalls?
Fourteen of Indiana’s 15 READI regions face a net owner-occupied housing shortfall through 2029. Only South Central, which covers Daviess, Martin, and Lawrence counties, is currently permitting at a pace that meets or exceeds projected need, and even there the forecast anticipates slower household growth than the prior period.
The most acute absolute shortfalls are in Central Indiana (90,370 units needed against 43,900 permits pulled since 2019), Northeast (18,343 units, +34% permit increase needed), and Northwest (17,166 units, +46%). But the most severe gaps relative to recent construction are elsewhere. East Central needs roughly 7,300 new owner units and would require a more than fourfold increase in its permit rate to get there. Wabash River faces a similar situation: 3,647 units needed against only 802 permits in the prior five years. For regions building at that pace, the practical question is not what percentage increase is needed but whether the local construction industry has the capacity to scale at all.
St. Joseph-Elkhart is a distinct case. It needs 10,145 units and has a 166 percent permit gap, the third-largest absolute shortfall in the state. But it is the only READI region with negative net migration since 2020, having lost more than 12,000 domestic residents even as 9,000 international arrivals partially offset those departures. The housing need is real, but the demographic foundation supporting it is more fragile than the headline numbers suggest.
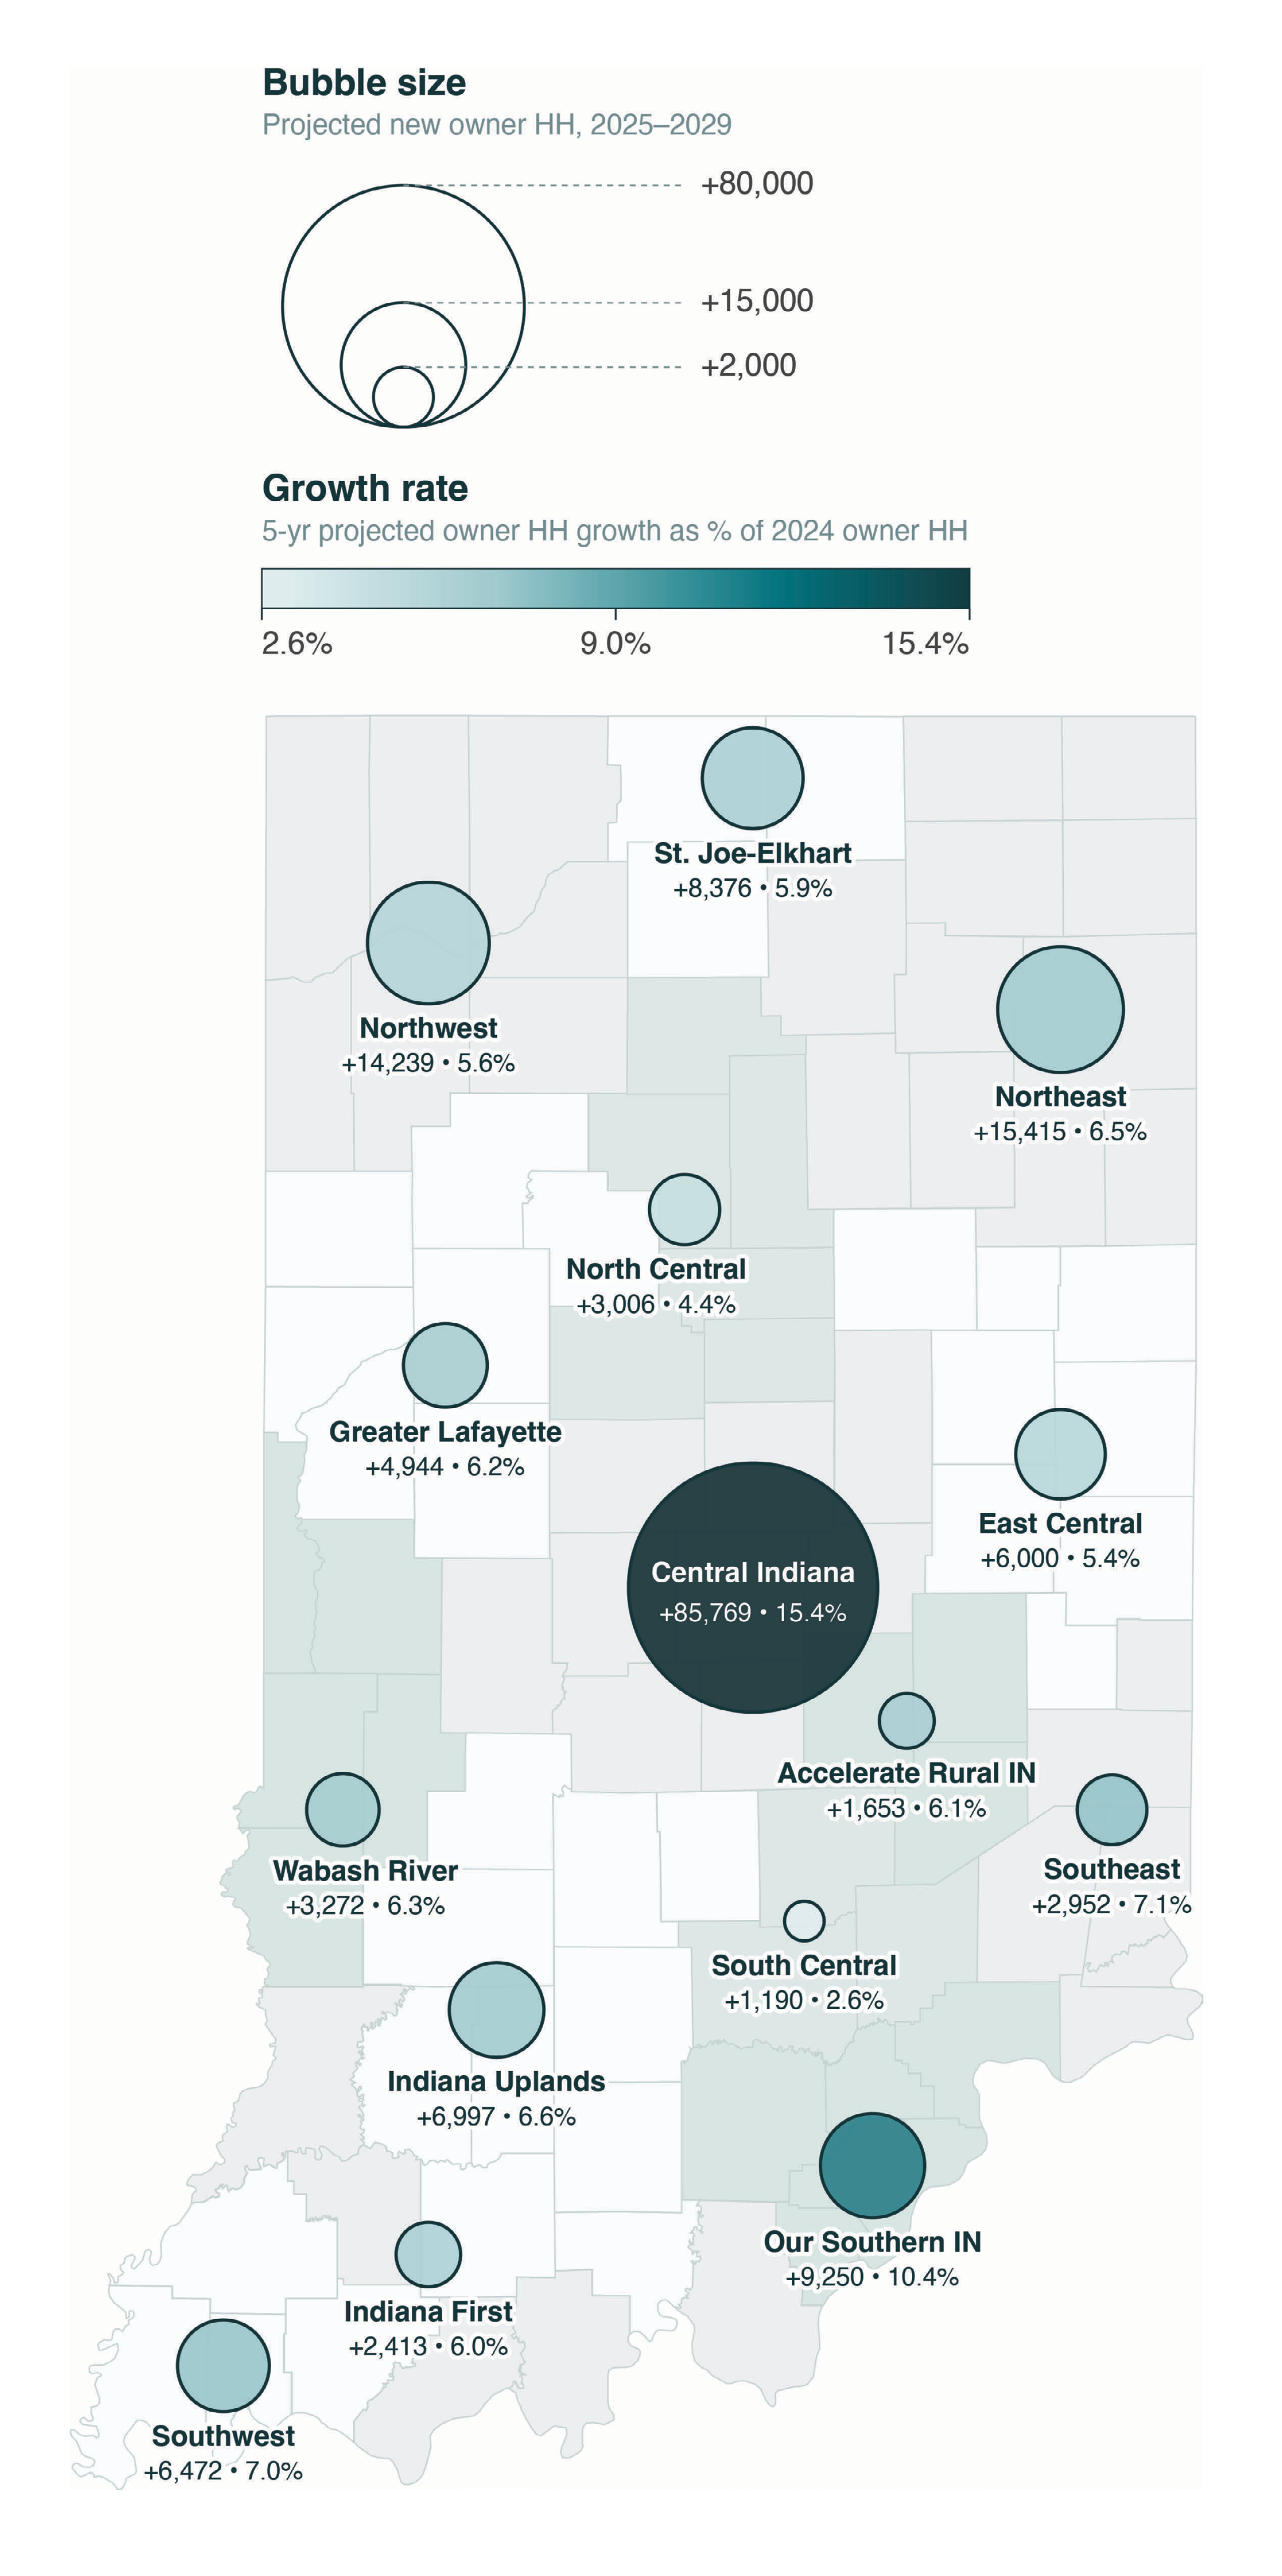
It is well-documented that the Indianapolis-Carmel metro is the dominant driver of statewide population growth, though Fort Wayne and Indiana’s share of the Louisville region in particular have increased their share of state growth at the MSA level since 2020.
Using READI classifications, Central Indiana remains in a category of its own with regard to homeowner household formation. The region is projected to add roughly 86,000 new owner-occupied households between 2025 and 2029, accounting for half of the state’s projected growth. The region’s growth has been accelerating, and the forecast projects that will continue: the region added about 21,000 owner households in the five years before 2019, then 62,000 in the five years after. The forecast projects that strong growth will continue, with evidence from strong demand signals (price and sales) and net migration of more than 81,000 people since 2020, more than half of them international arrivals.
Northeast and Northwest are the next strongest, each projecting 14,000 to 15,000 new owner households. Both recorded strong growth in the 2019 to 2024 period and have positive net migration, though domestic out-migration is a headwind in both. Our Southern Indiana, buoyed by strong domestic in-migration of more than 13,000 since 2020, is forecast to add roughly 9,250 owner households, essentially maintaining its recent pace.
Greater Lafayette’s forecast of roughly 5,000 new owner households warrants a closer look. The region shows positive net migration overall, but that figure obscures a domestic loss of more than 6,200 residents offset by 10,500 international arrivals, a pattern consistent with a large university presence. The housing demand those arrivals generate is real. Whether it translates into owner-occupied household formation at the rate the model anticipates depends on factors, including visa status and income, that aggregate migration counts do not capture.
Central Indiana dominates the need for increased construction, but all regions except South Central need more construction.
Forecasted new supply needed by 2029 compared to permits 2019-2024
The most consequential gaps in absolute terms are in Central Indiana, where 46,000 more units are needed than permits pulled over the past five years, and St. Joseph-Elkhart, short by roughly 6,300. These are markets large enough that the shortfall has real effects on prices and availability today.
Elsewhere the challenge is less about scale than capacity. Wabash River and East Central each need roughly three to four times as many permits as they have been pulling, across regions where the construction industry has not historically operated at that pace. Indiana Uplands faces the same dynamic across ten counties.
The findings in this report point in one direction: Indiana is not building enough owner-occupied housing and the gap is structural, not a product of one unusual year or one overheated market. It shows up in 81 of the state’s 92 counties, across fast-growing suburban rings, mid-sized regional centers, and rural communities alike. The problem is not identical everywhere, but it exists nearly everywhere.
For REALTORS®, the practical implications are immediate. A statewide owner vacancy rate of 0.83 percent means that in most markets, buyers have fewer choices, competition is more intense, and the ability of new households to form is constrained by the absence of homes to purchase despite relatively moderate demand.
The counties with the tightest vacancy are the markets where those pressures are most acute today. The 25 counties where vacancy offers a modest buffer are where that buffer is most at risk of being consumed by projected household growth over the next five years.
For policymakers, the regional data offer a more granular view of where intervention is most needed and where the construction industry faces the steepest scaling challenge. East Central, Wabash River, and Indiana Uplands are not failing to build because demand is absent. Migration is positive, household growth is projected, and the supply gap is real. But these regions seem to lack the construction capacity to respond, or market disruptions that inhibit an adequate response. Addressing these gaps require a multi-faceted approach that includes permitting and land use reforms, attention to the workforce, financing mechanisms and infrastructure support to create a climate where builders can actually operate at the pace of market demand.
This analysis is meant to provide a useful layer of specificity to community dialogue and policy debates over housing development that are already well underway; the past five years have seen a more focused pursuit of pro-housing initiatives:
As noted previously, the READI program emerged as a significant source of housing development funding based on priorities that emerged from regional partnerships across Indiana; roughly 40 percent of the first round of READI grants were targeted to housing.
The state has allocated $75 million over two biennial budget cycles since 2023 to the Indiana Residential Infrastructure Assistance Program, a revolving loan fund to help local governments finance the infrastructure costs associated with new housing projects (in tandem with revised tax increment financing regulations that allow local units to capture revenues for loan repayment).
House Enrolled Act 1005 (2025) set criteria for cities and towns to expedite access to these loans; HEA1005 also helps ease regulatory delays by giving builders more options to meet local inspection and plan review requirements.
The state’s FY2025-2026 budget also established a pilot Home Repair Matching Grant Program with $250,000 – a step towards reinvesting in existing housing stock.
House Enrolled Act 1001 (2026) sought to address local regulatory and land use policies that were identified as significant barriers to new housing; while initial proposals were scaled back, the enacted law:
These legislative and programmatic efforts represent progress but are not cause for complacency – as the shortfalls identified in this report make clear.
The forecast period runs through 2029. This is not a long runway. The households that will need homes in 2027 are forming now, and the decisions about where and what to build are being made today. At the household level, potential migrants are evaluating moving options, renter households are saving and working towards financial readiness to become homeowners, and today’s homeowners are evaluating future housing needs – and all of their plans are impacted by current supply-and-demand imbalances and affordability pressures.
The data in this report, and the county-level detail available in the companion dashboard, are intended to inform decisions at the planning and policy levels with the best available evidence about where demand is headed and how far the current supply trajectory falls short, with the ultimate goal of protecting affordable and achievable homeownership as an option for the greatest possible number of Hoosier households.
The supply gap reported for each county and region has three components: homes needed to house projected new households; homes needed to replace units lost from the existing stock through demolition, deterioration, or conversion; and homes needed to restore vacancy to a functional equilibrium. For owner-occupied housing, 1 percent is used as the equilibrium vacancy rate and 5 percent for rental housing. These are standard industry benchmarks and are consistent with Indiana’s recent pre-crisis history: the state’s for-sale owner vacancy rate was 1.3 percent in 2018 and had fallen to 0.8 percent by 2023, bracketing the 1 percent threshold as a reasonable norm.¹
It is worth noting what this vacancy measure includes and excludes. The vacancy rates reported here count only homes that are vacant and actively listed for sale, as a share of the total owner market. They do not include seasonal homes, properties in foreclosure, units already under contract, homes held for personal reasons, or other categories of vacant units that appear in broader ACS vacancy figures. Statewide, only about 16,000 of Indiana’s roughly 260,000 total vacant units are for-sale inventory. That distinction matters: a county may show a high overall vacancy rate in ACS data while having almost no homes actually available for a buyer to purchase.
The formula applied to each county is: supply gap = projected new households + anticipated housing loss, minus excess vacancy above equilibrium. Housing loss is estimated using the Census Bureau’s methodology for housing unit loss, which applies rates derived from the Components of Inventory Change (CINCH) supplement to the American Housing Survey, differentiated by structure type, age of unit, and Census region. Older homes and mobile homes carry substantially higher loss rates than newer single-family construction. Midwest regional rates are applied throughout.²
Owner-occupied and renter household formation are forecast separately using a rolling five-year window regression model estimated at the county level. For each historical window, the model is trained on anchor-year conditions and asked to predict the change in households five years later. Predictors include home prices and sales volume, recent household growth trends, year-over-year employment change, five-year domestic and international migration levels, migration rates as a share of total households, and interactions between market size and migration. For the production forecast, all valid historical windows are used for training and the model is applied to 2024 conditions to generate the 2025 to 2029 projection.
The model is evaluated using a leave-one-window-out procedure in which each test window is predicted using only data from earlier periods. Five windows are tested for the owner model (holdout anchor years 2015 through 2019) and four for the renter model (2016 through 2019), covering all 92 counties in each window. Across 460 owner-model test cases, the correlation between predicted and actual change is 0.963, the median absolute error is 316 households, and wrong-direction errors account for fewer than 5 percent of predictions. Full validation statistics are reported in the technical documentation at data.indianarealtors.com/housing/method/.
1. American Community Survey One-Year Estimates, owner vacancy rates for Indiana, 2013, 2018, and 2023. Vacancy is calculated as vacant-for-sale units as a share of the owner market (owner-occupied plus vacant-for-sale plus sold-not-yet-occupied). See https://www.census.gov/housing/hvs/definitions.pdf for definitions of vacancy categories.
2. U.S. Census Bureau, Housing Unit Estimates Methodology, 2020–2021. https://www2.census.gov/programs-surveys/popest/technical-documentation/methodology/2020-2021/2021-hu-method.pdf. Loss rates are applied by structure type and age cohort using Midwest regional rates from the CINCH supplement to the American Housing Survey.
American Community Survey, U.S. Census Bureau. 5-year estimates for owner-occupied units, renter-occupied units, vacancy counts by type, and housing stock characteristics. Base year 2019, current year 2024. Retrieved via the tidycensus R package.
Quarterly Census of Employment and Wages (QCEW), U.S. Bureau of Labor Statistics. Annual average employment by county, all industries. Year-over-year change used as a model input.
Building permits, Indiana Department of Workforce Development via HoosierData. Single-family residential building permits by county, used as a proxy for owner-occupied construction activity.
Census Bureau county population estimates. Cumulative population and migration components of change, April 2020 through July 2025. Used for migration inputs in the production forecast and for regional migration analysis. U.S. Census Bureau, Annual Estimates of the Resident Population and Components of Change for Counties in Indiana (CO-EST2025-COMP-18).
MLS home sales data. County-level home sales volume and mean sale price. Sales volume interacted with mean price is the strongest positive predictor in the owner model.
STATS Indiana / Indiana Business Research Center. County-level population projections at 2020 and 2025 benchmarks, with intermediate years linearly interpolated.
Census Bureau housing unit loss methodology. U.S. Census Bureau, Housing Unit Estimates Methodology, 2020–2021. https://www2.census.gov/programs-surveys/popest/technical-documentation/methodology/2020-2021/2021-hu-method.pdf
American Housing Survey: Components of Inventory Change (CINCH). U.S. Department of Housing and Urban Development and U.S. Census Bureau. Loss rates by structure type, age of unit, and Census region. Available at huduser.gov/portal/datasets/cinch.html
Technical documentation. A complete description of the model specification, variable definitions, validation procedure, and full error metrics is available at data.indianarealtors.com/housing/method/
Contact. Questions about this study should be directed to the Indiana Association of REALTORS® ([email protected]).