With rates averaging 50 basis points lower than last year, sales are up 2.5% year-to-date.
We forecast the state needs to double the rate of construction to meet housing needs by 2029.

The market has slowed, but not for everyone. Correctly priced homes still go under contract in about a week. The slowdown is concentrated in mispriced listings.

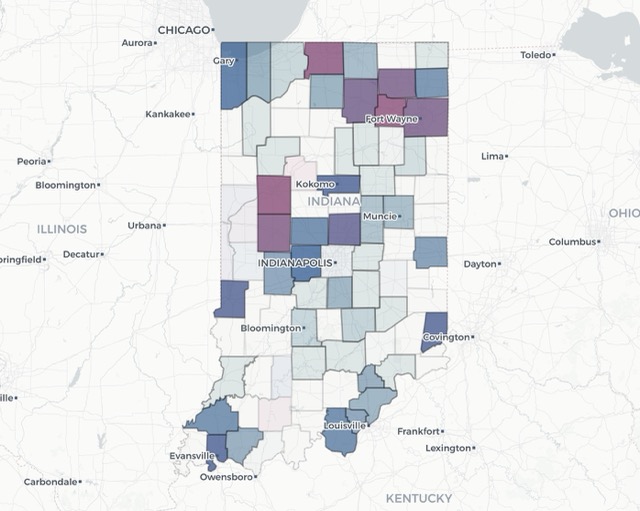
Indiana sellers see 5.4% annual appreciation in Q1 2026
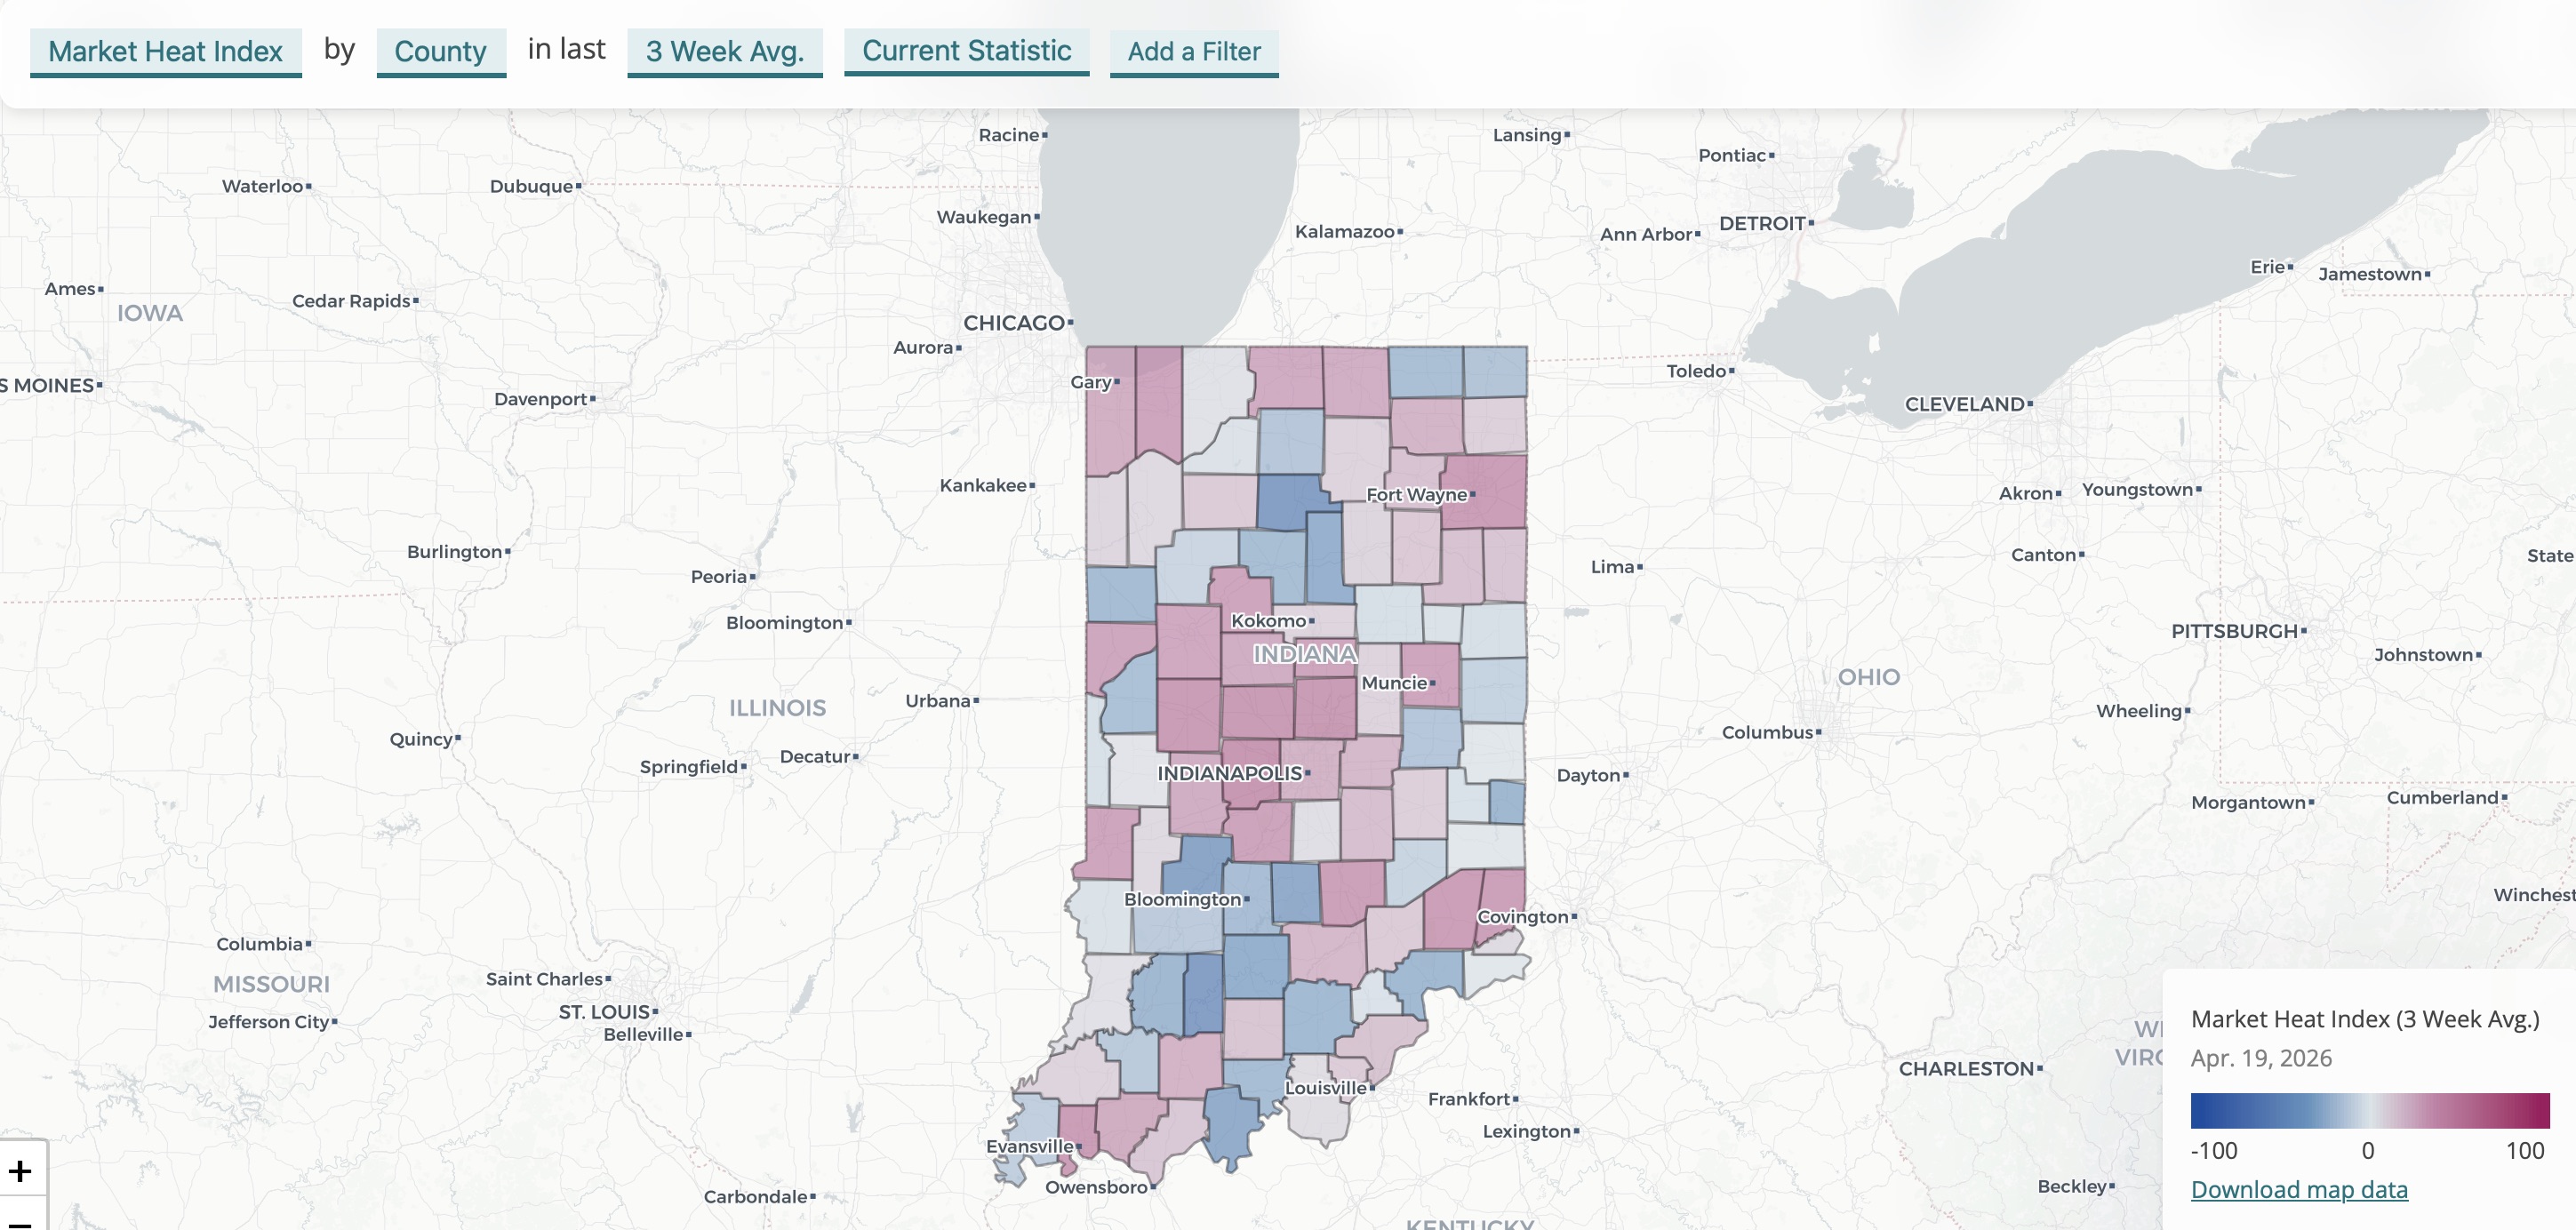
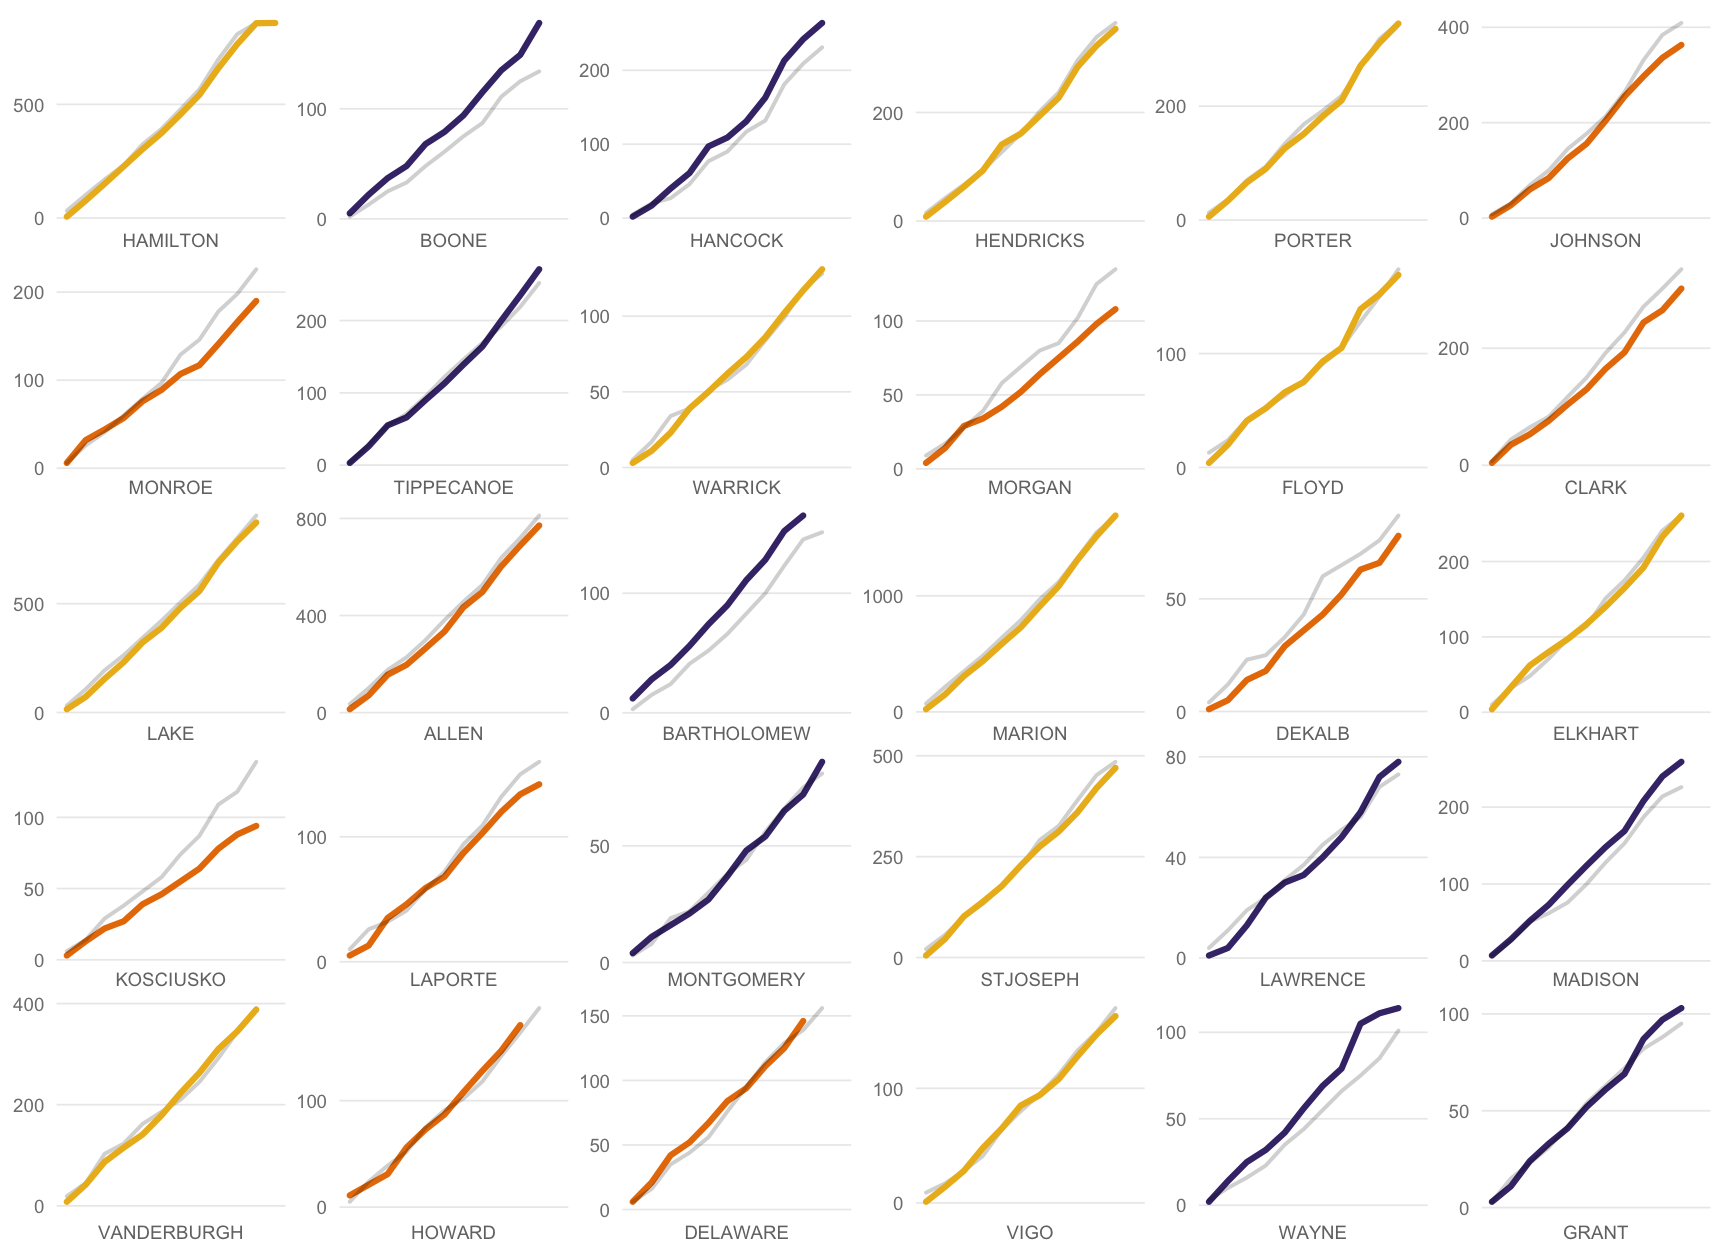
Hendricks, Hamilton & Boone counties are Indiana's hottest housing markets right now. Buyers are absorbing new listings nearly as fast as they hit the market. See how your county stacks up on our Market Heat Index.
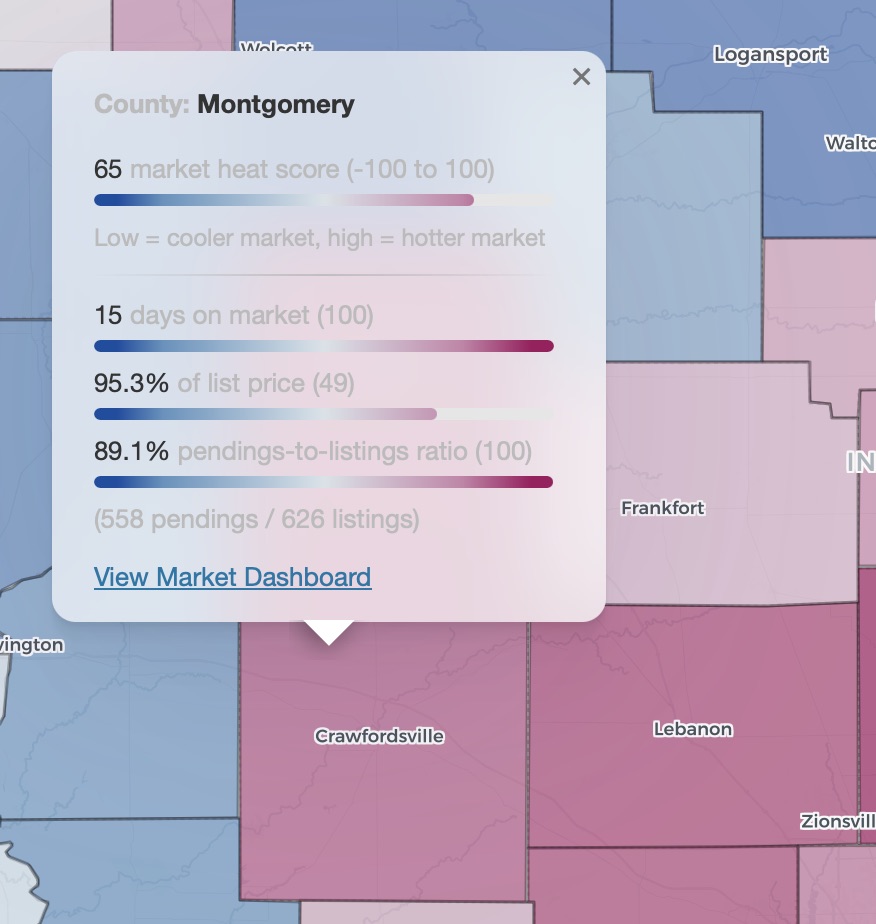
The new Market Heat Index maps demand pressure across every county in the state, combining days on market, list price performance, and pending contract activity into a single score. Explore the map to see where conditions are heating up and where they're easing off.
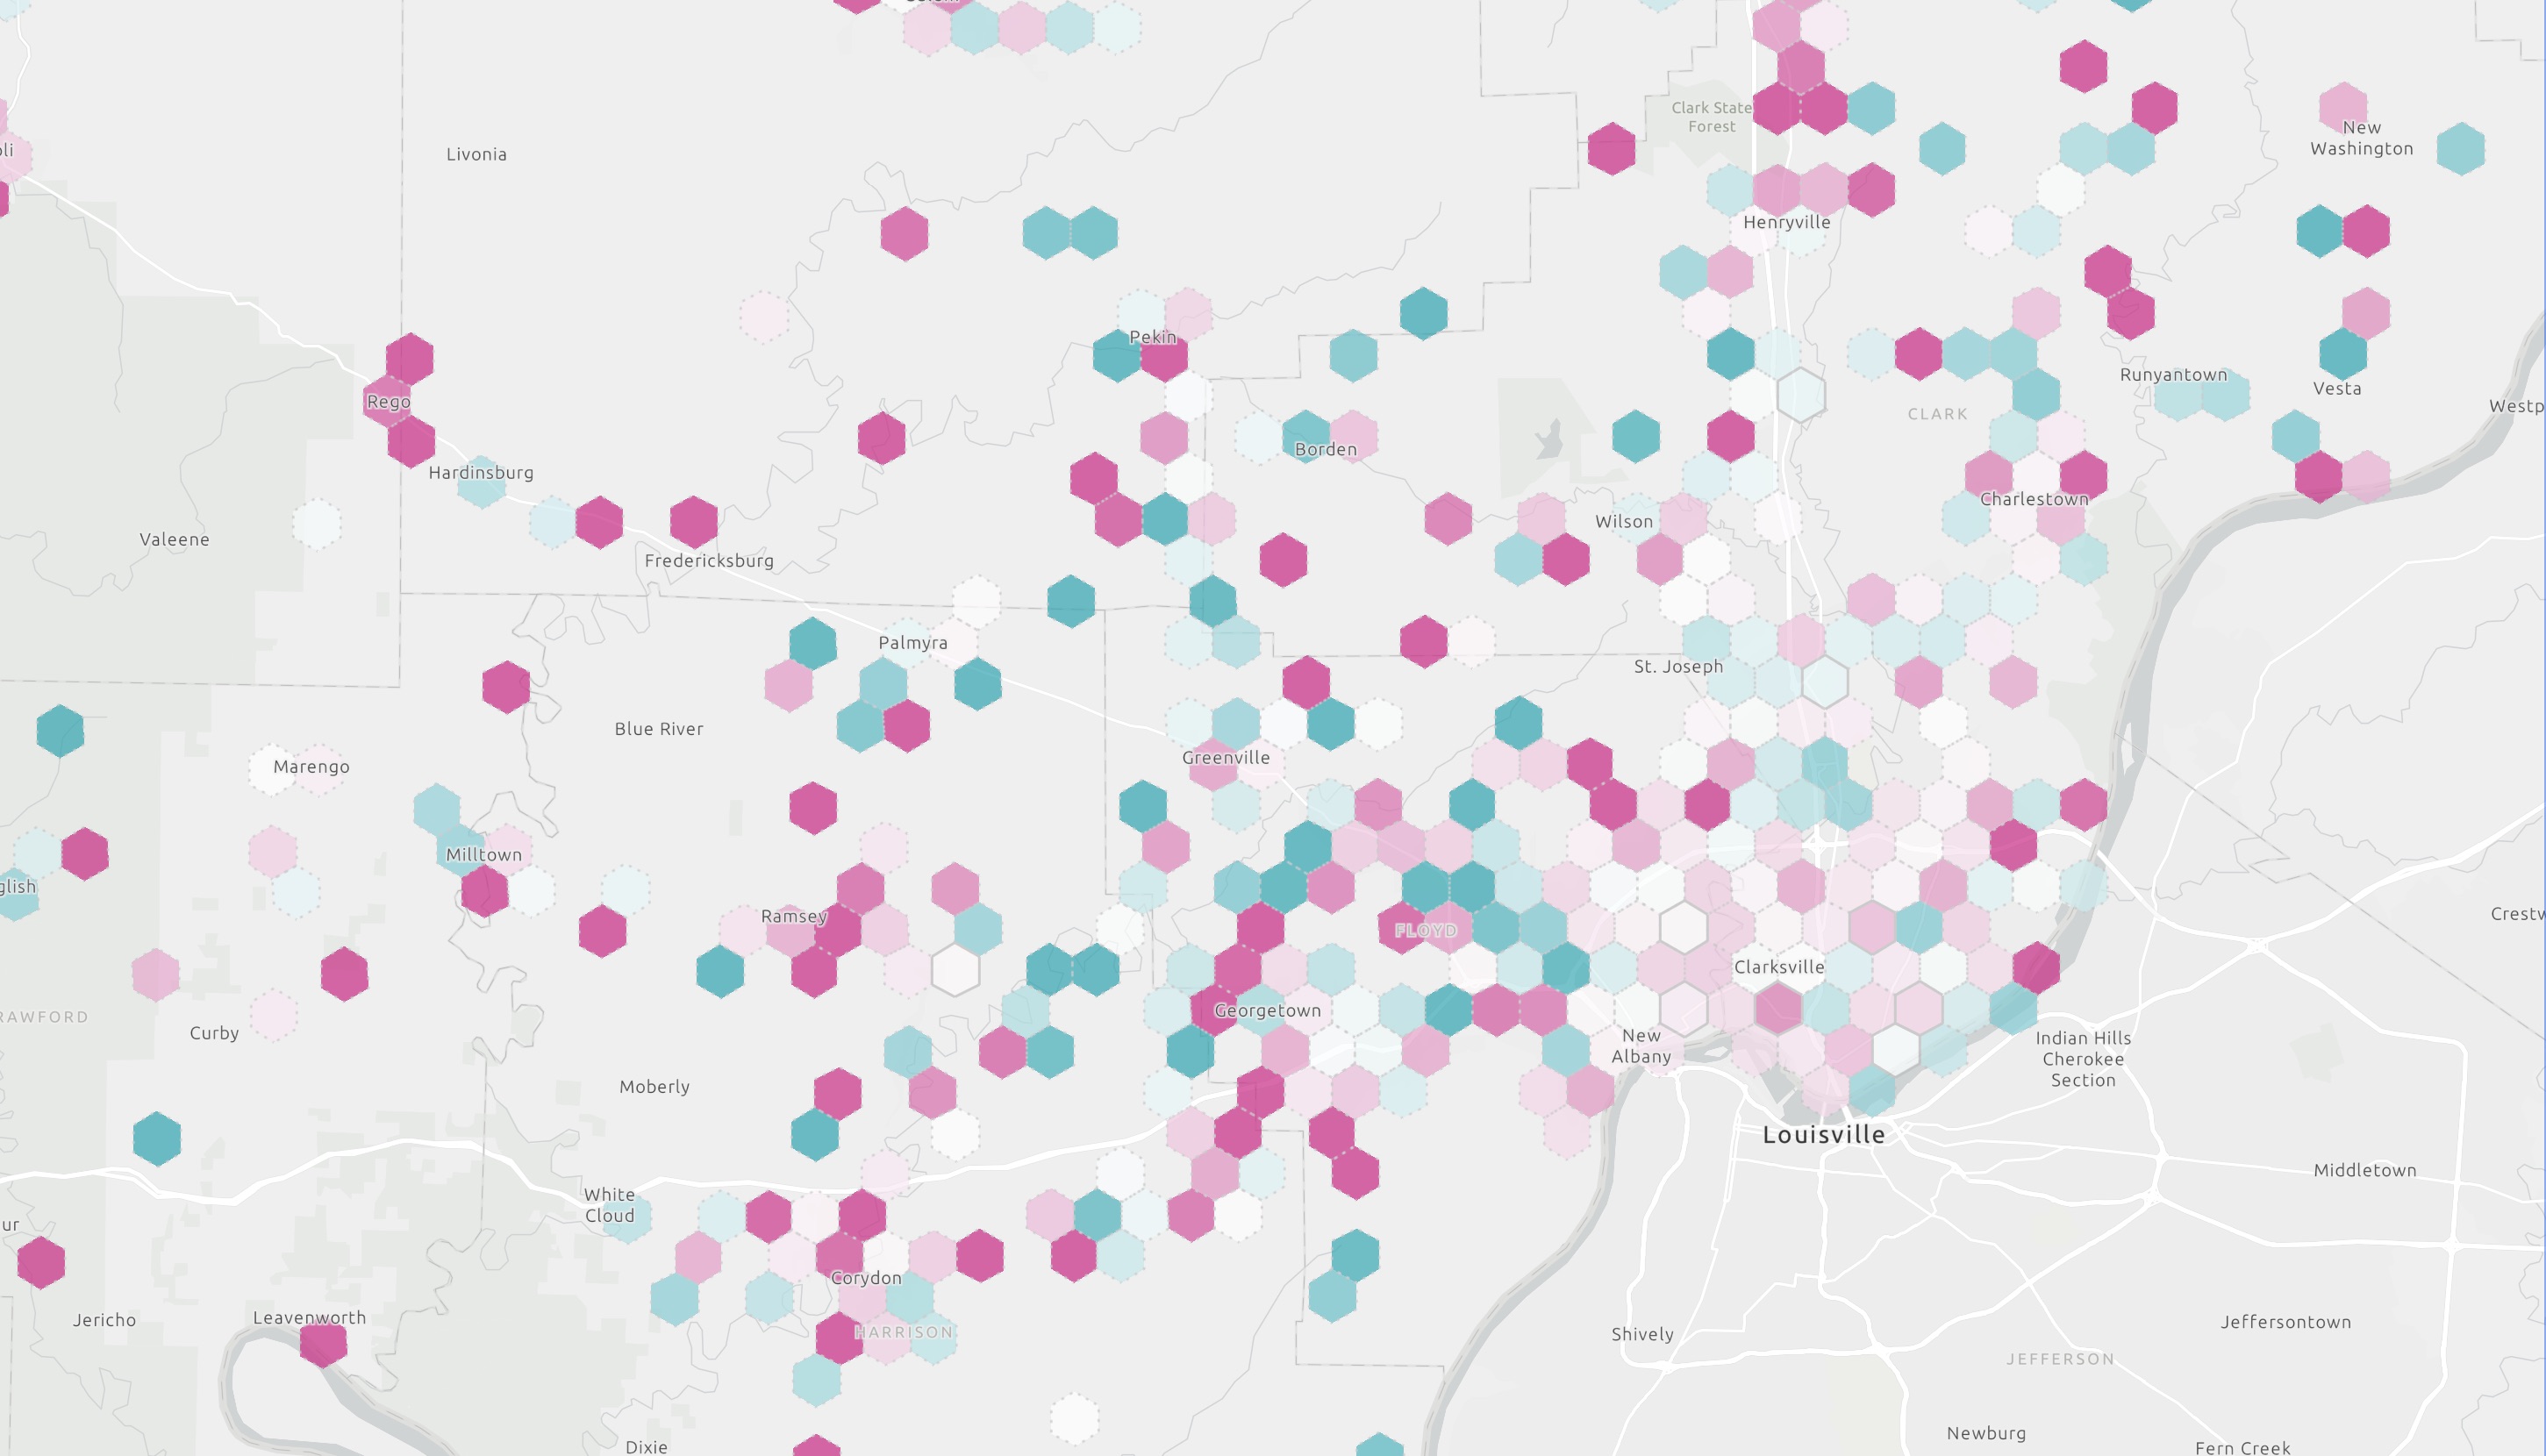
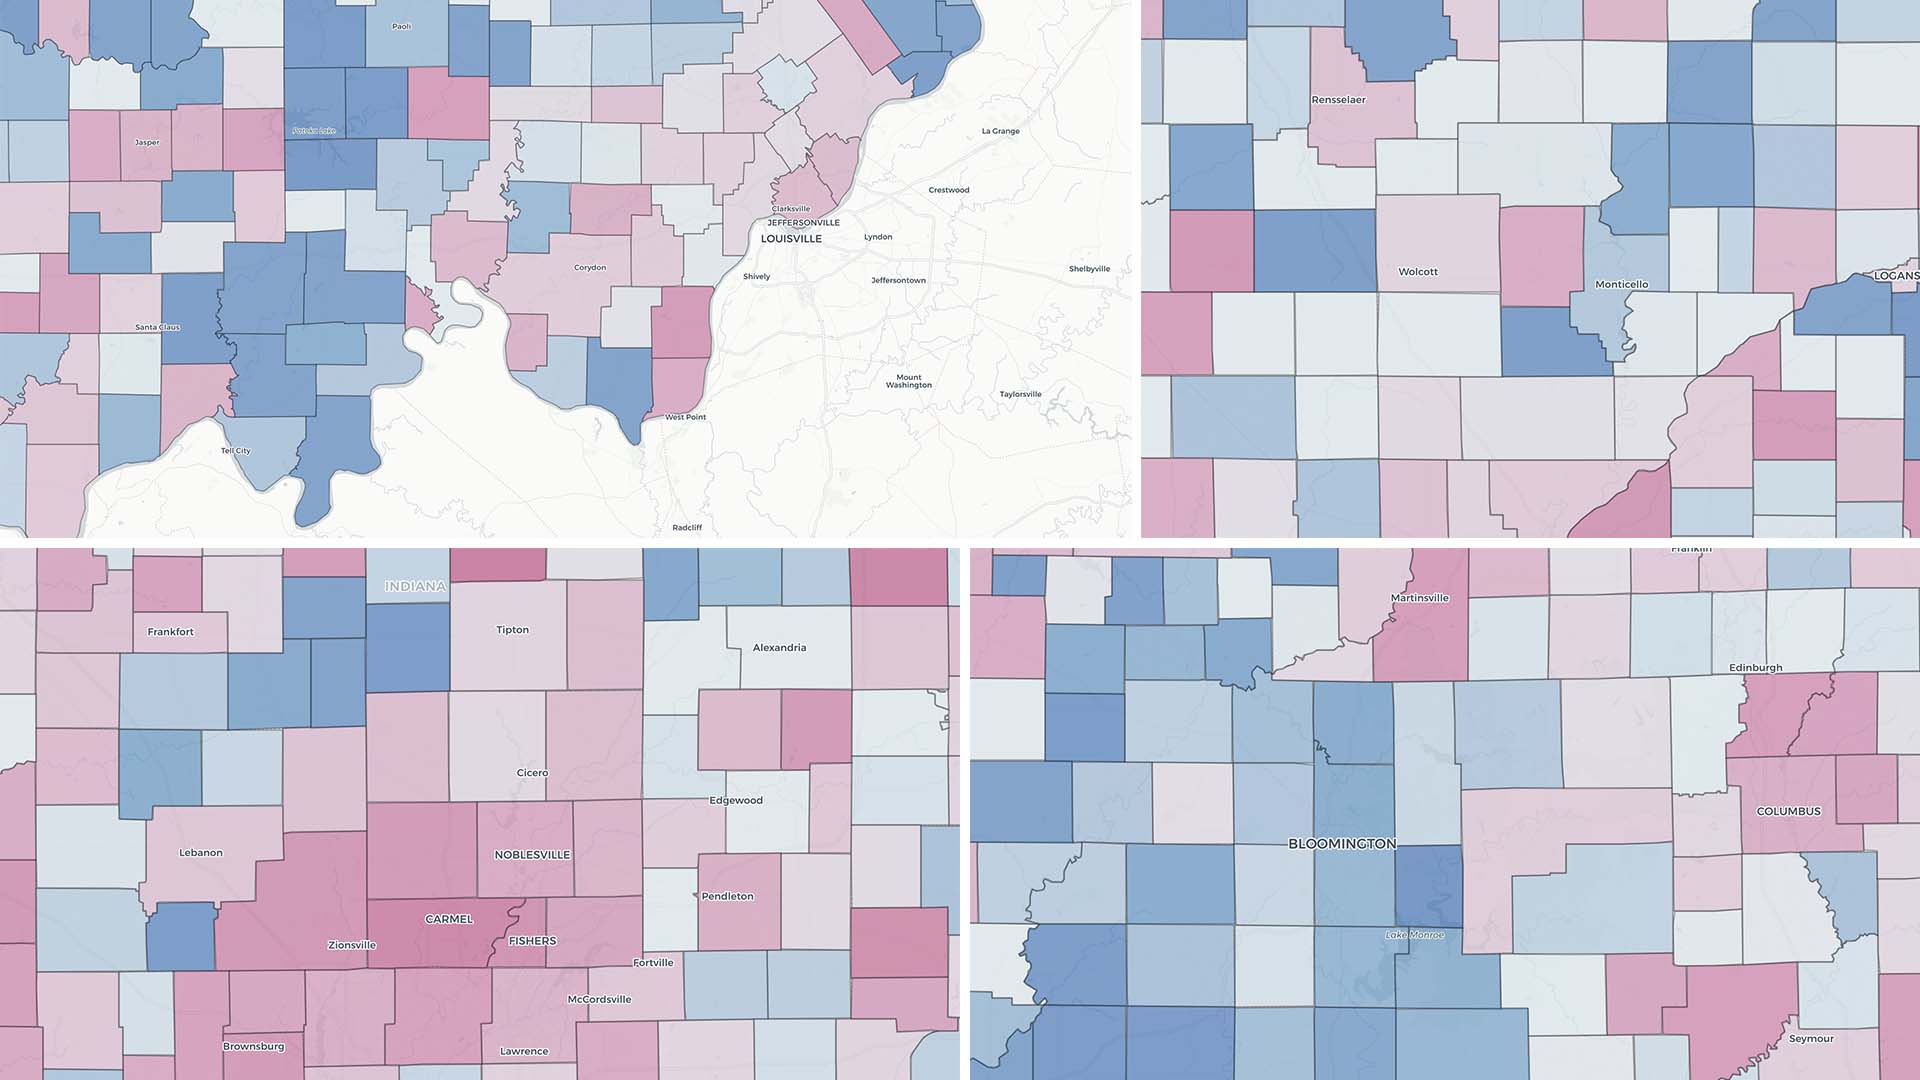
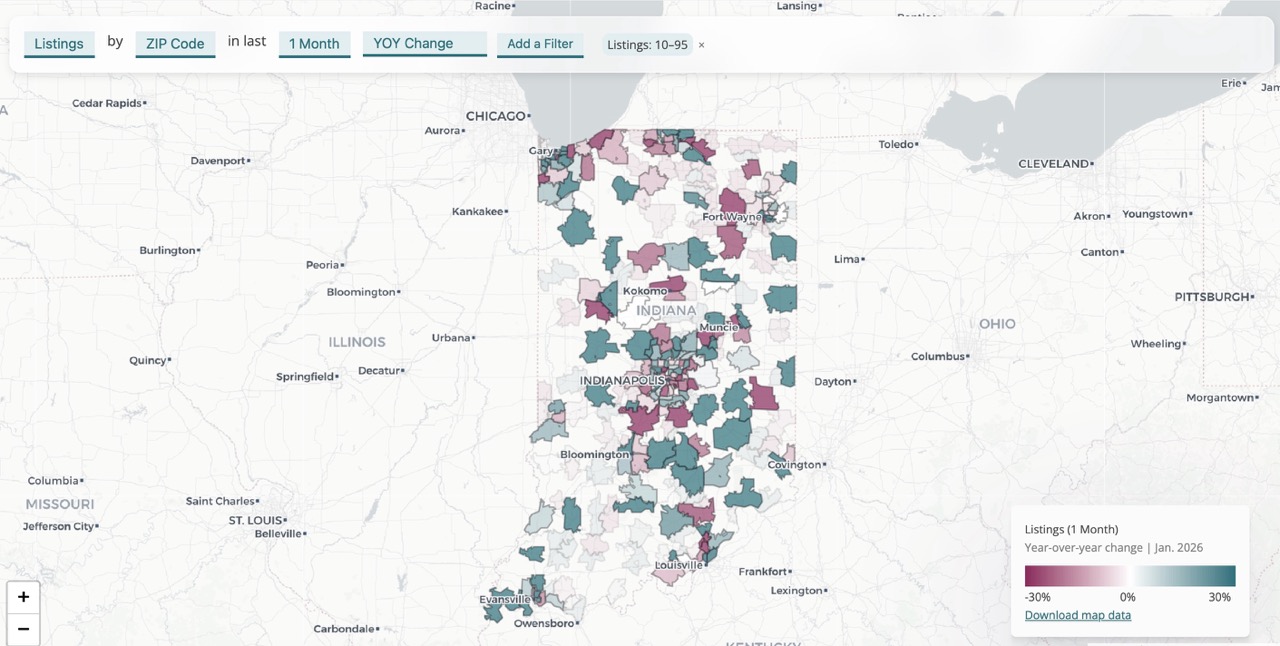
This map breaks the market down to half-mile hexagons, showing where prices rose, where they fell, and how much each neighborhood changed in 2025.
Monday Map, March 30, 2026
Monday Map, March 23, 2026
Monday Map, March 9, 2026
Monday Map, February 16, 2026
Monday Map, Feb. 2, 2026
Monday Map, January 26, 2026

Sales were up 2% in 2025, and we forecast sales to rise by 3% in 2026 driven by an interest rate forecast of 6.2%.