Market Fundamentals
Rates averaged 50 basis points lower than last year, driving sales up 2.5% year-to-date.
↓
While housing markets are shaped by local and regional trends, any report on the real estate climate has to start at a much higher level – mortgage rates have averaged 6.25% year-to-date in 2026 (via the weekly Freddie Mac Primary Mortgage Market Survey), slightly above our annualized projection but more than 50 basis points below 2025.
However, while rates have been consistently better than last year, they were at their lowest in January and February before the war in Iran, rising inflation and spring employment data caused rates to climb back towards 6.5%.
Buyers were cautious at the beginning of the year, and the market lost most of a week to winter weather at the end of January. Closings were in negative year-over-year territory until March. Eventually lower rates and higher inventory turned into new contracts and closed sales: In June, closings were up 8% over 2025.
The steady increase in sales from -5% YOY to +8% YOY resulted in a total of 39,000 closings in the first half of the year, compared to 38,000 in 2025. Pendings are also up 3% year-to-date.
Sellers were even more enthusiastic, as new listings are up 5% year-to-date. The gap between listings and sales meant rising inventory: 15,402 homes were available statewide on an average day through the first half of 2026, 13% ahead of 2025.
However, the growth in inventory and sales is not consistent. The share of recent listings affordable to a household earning $75,000 or less has fallen from 47% in January to less than 36% in June. This trend is attributable to both the upturn in mortgage rates and year-over-year price appreciation.
Median price growth was driven by a changing mix of home sales and rising prices.
Fewer homes under $250K sold, while sales growth was strongest in the $250K-$749K sale price range. Meanwhile, price per square foot increased for all but the lowest- and highest-priced segments.
This data suggests a market dominated by repeat buyers rolling their sale proceeds into their next home.
It is hard to enter the market: Only one of every five renter households statewide earns enough to comfortably purchase a home at or above $250,000 with a 10% down payment at 2026 average rates.
How Deals Changed from 2025 to 2026
For listings without a price cut, the market is moving as fast as last year. For other listings, the market is one week slower. Sale-to-list ratio was steady for the middle of the market but fell for the highest and lowest price ranges.
↓
In most of Indiana's market, seller reductions and buyer discounts barely changed from 2025 to 2026. Below $150K, both increased significantly. Sellers cut 10% on average, up from 9.2%, and buyers negotiated an additional 2.7% off, up from 2.1%. At the top end, luxury sellers are also cutting more (6.9% to 8.3%), but buyers are not negotiating down as much.
These listings go under contract in 81 days, compared to 74 days last year. Listings without a price cut go under contract in 8 days compared to 7 days.
From $150K-$499K, it took price-cut listings a week longer to get under contract. For $500K-$749K, it took two weeks longer. For $1M+ it took four weeks longer (151 days compared to 123 days).
REALTOR® expertise is as important as ever.
Homes that are priced well move quickly and often have minimal concessions in buyer negotations. In the luxury market, however, a slower market is unavoidable: Nearly all $1M+ sellers reduce price at some point, and those homes are on the market four weeks longer than in 2025.Market Heat Index
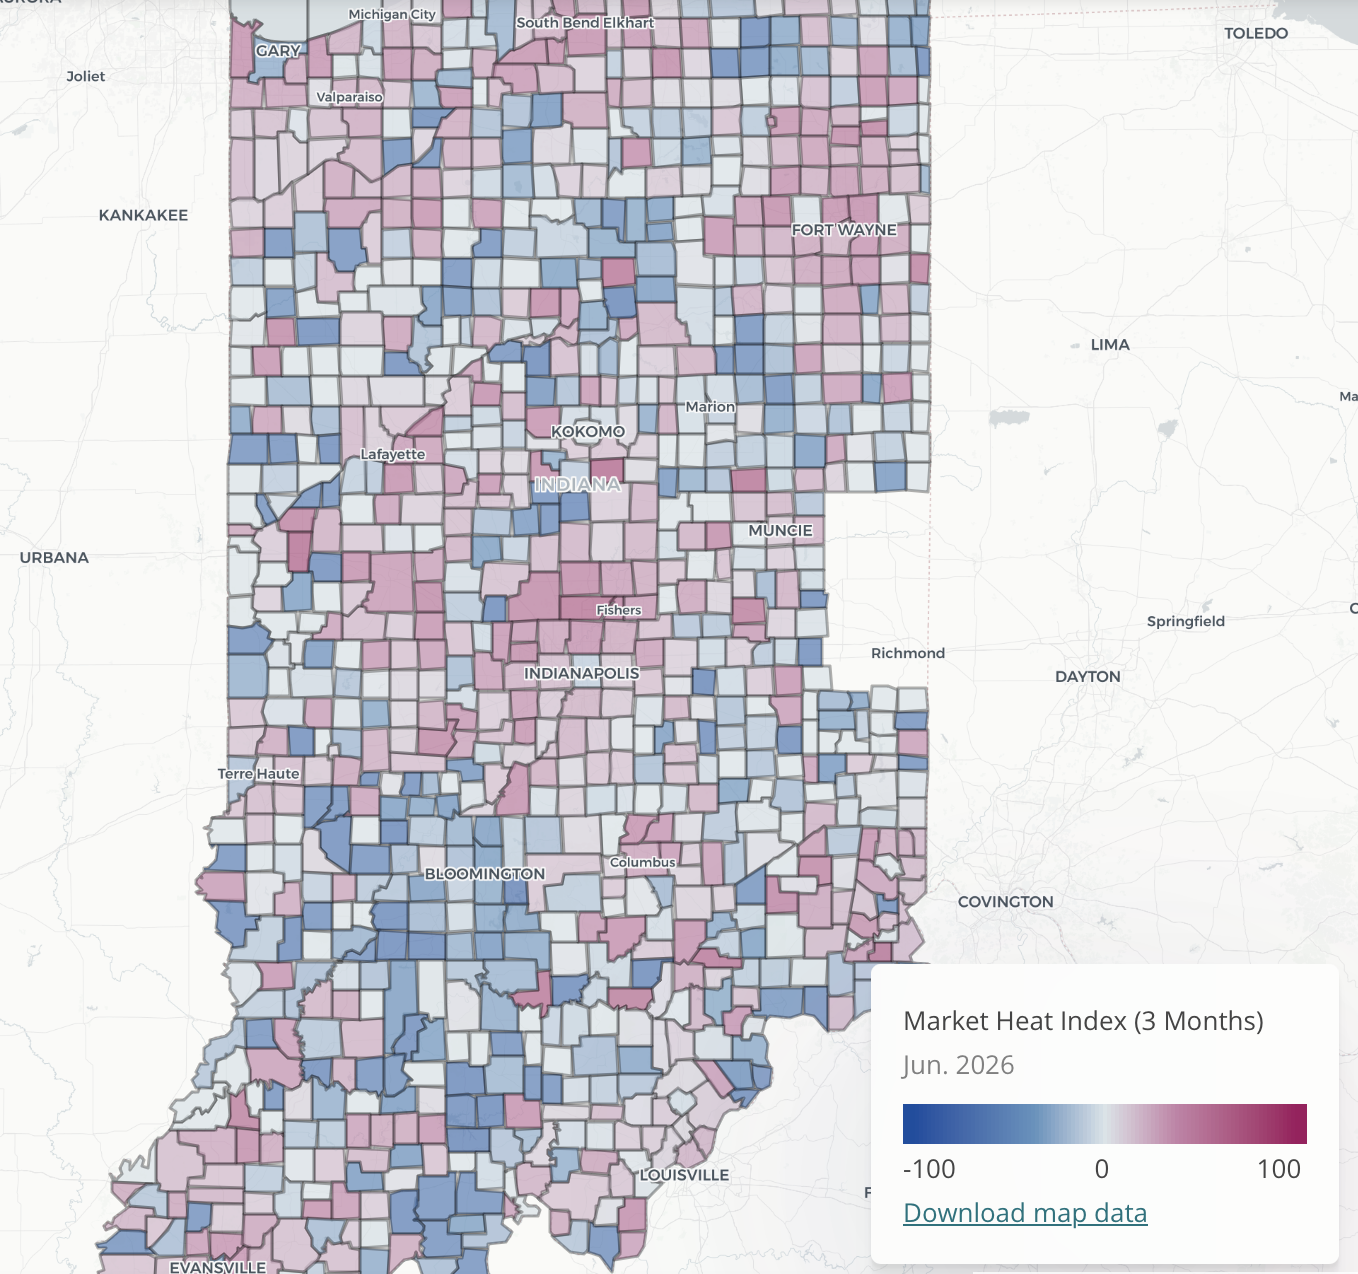
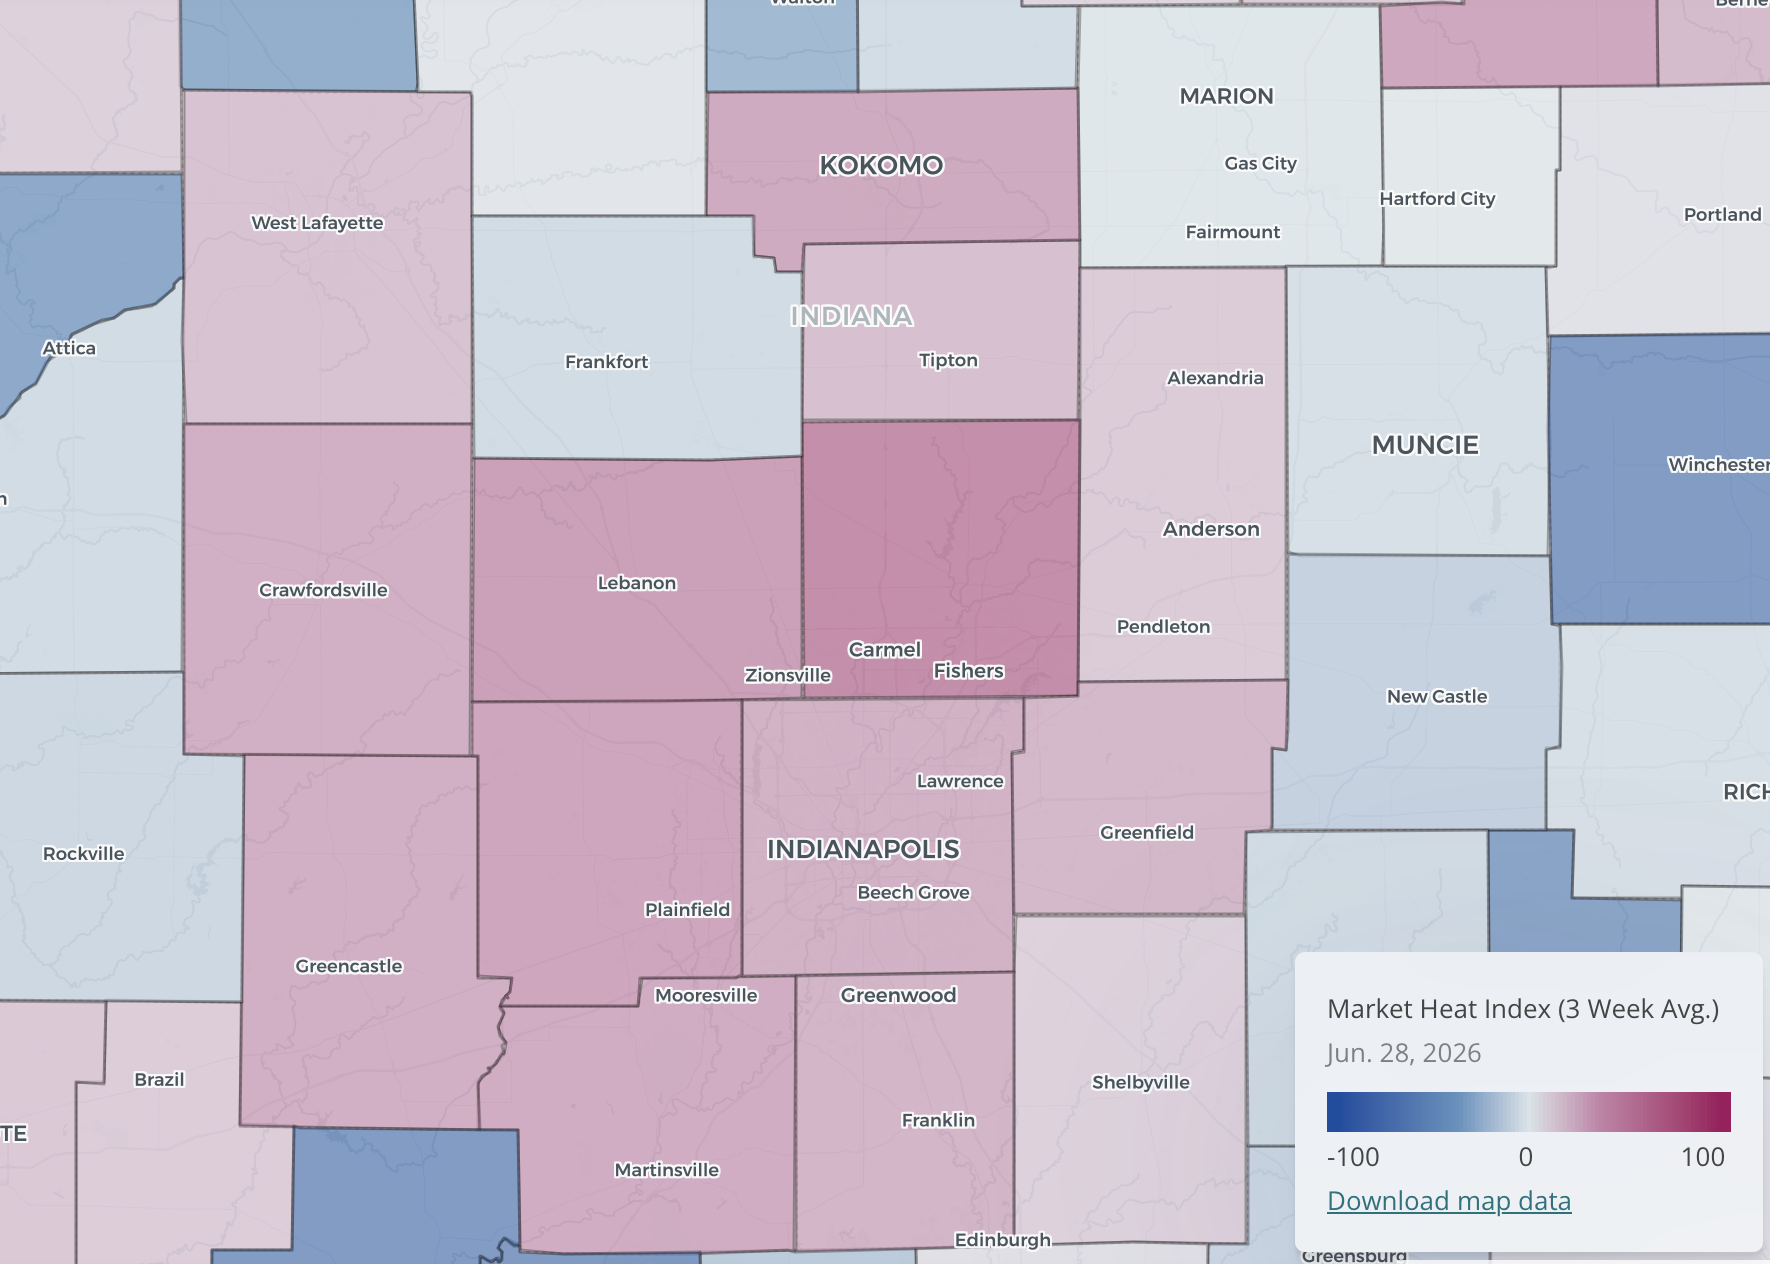
Our new index combines sale-to-list ratio, days on market, and the absorption rate of pendings compared to listings to analyze how hot markets are compared to the rest of the state.
↓
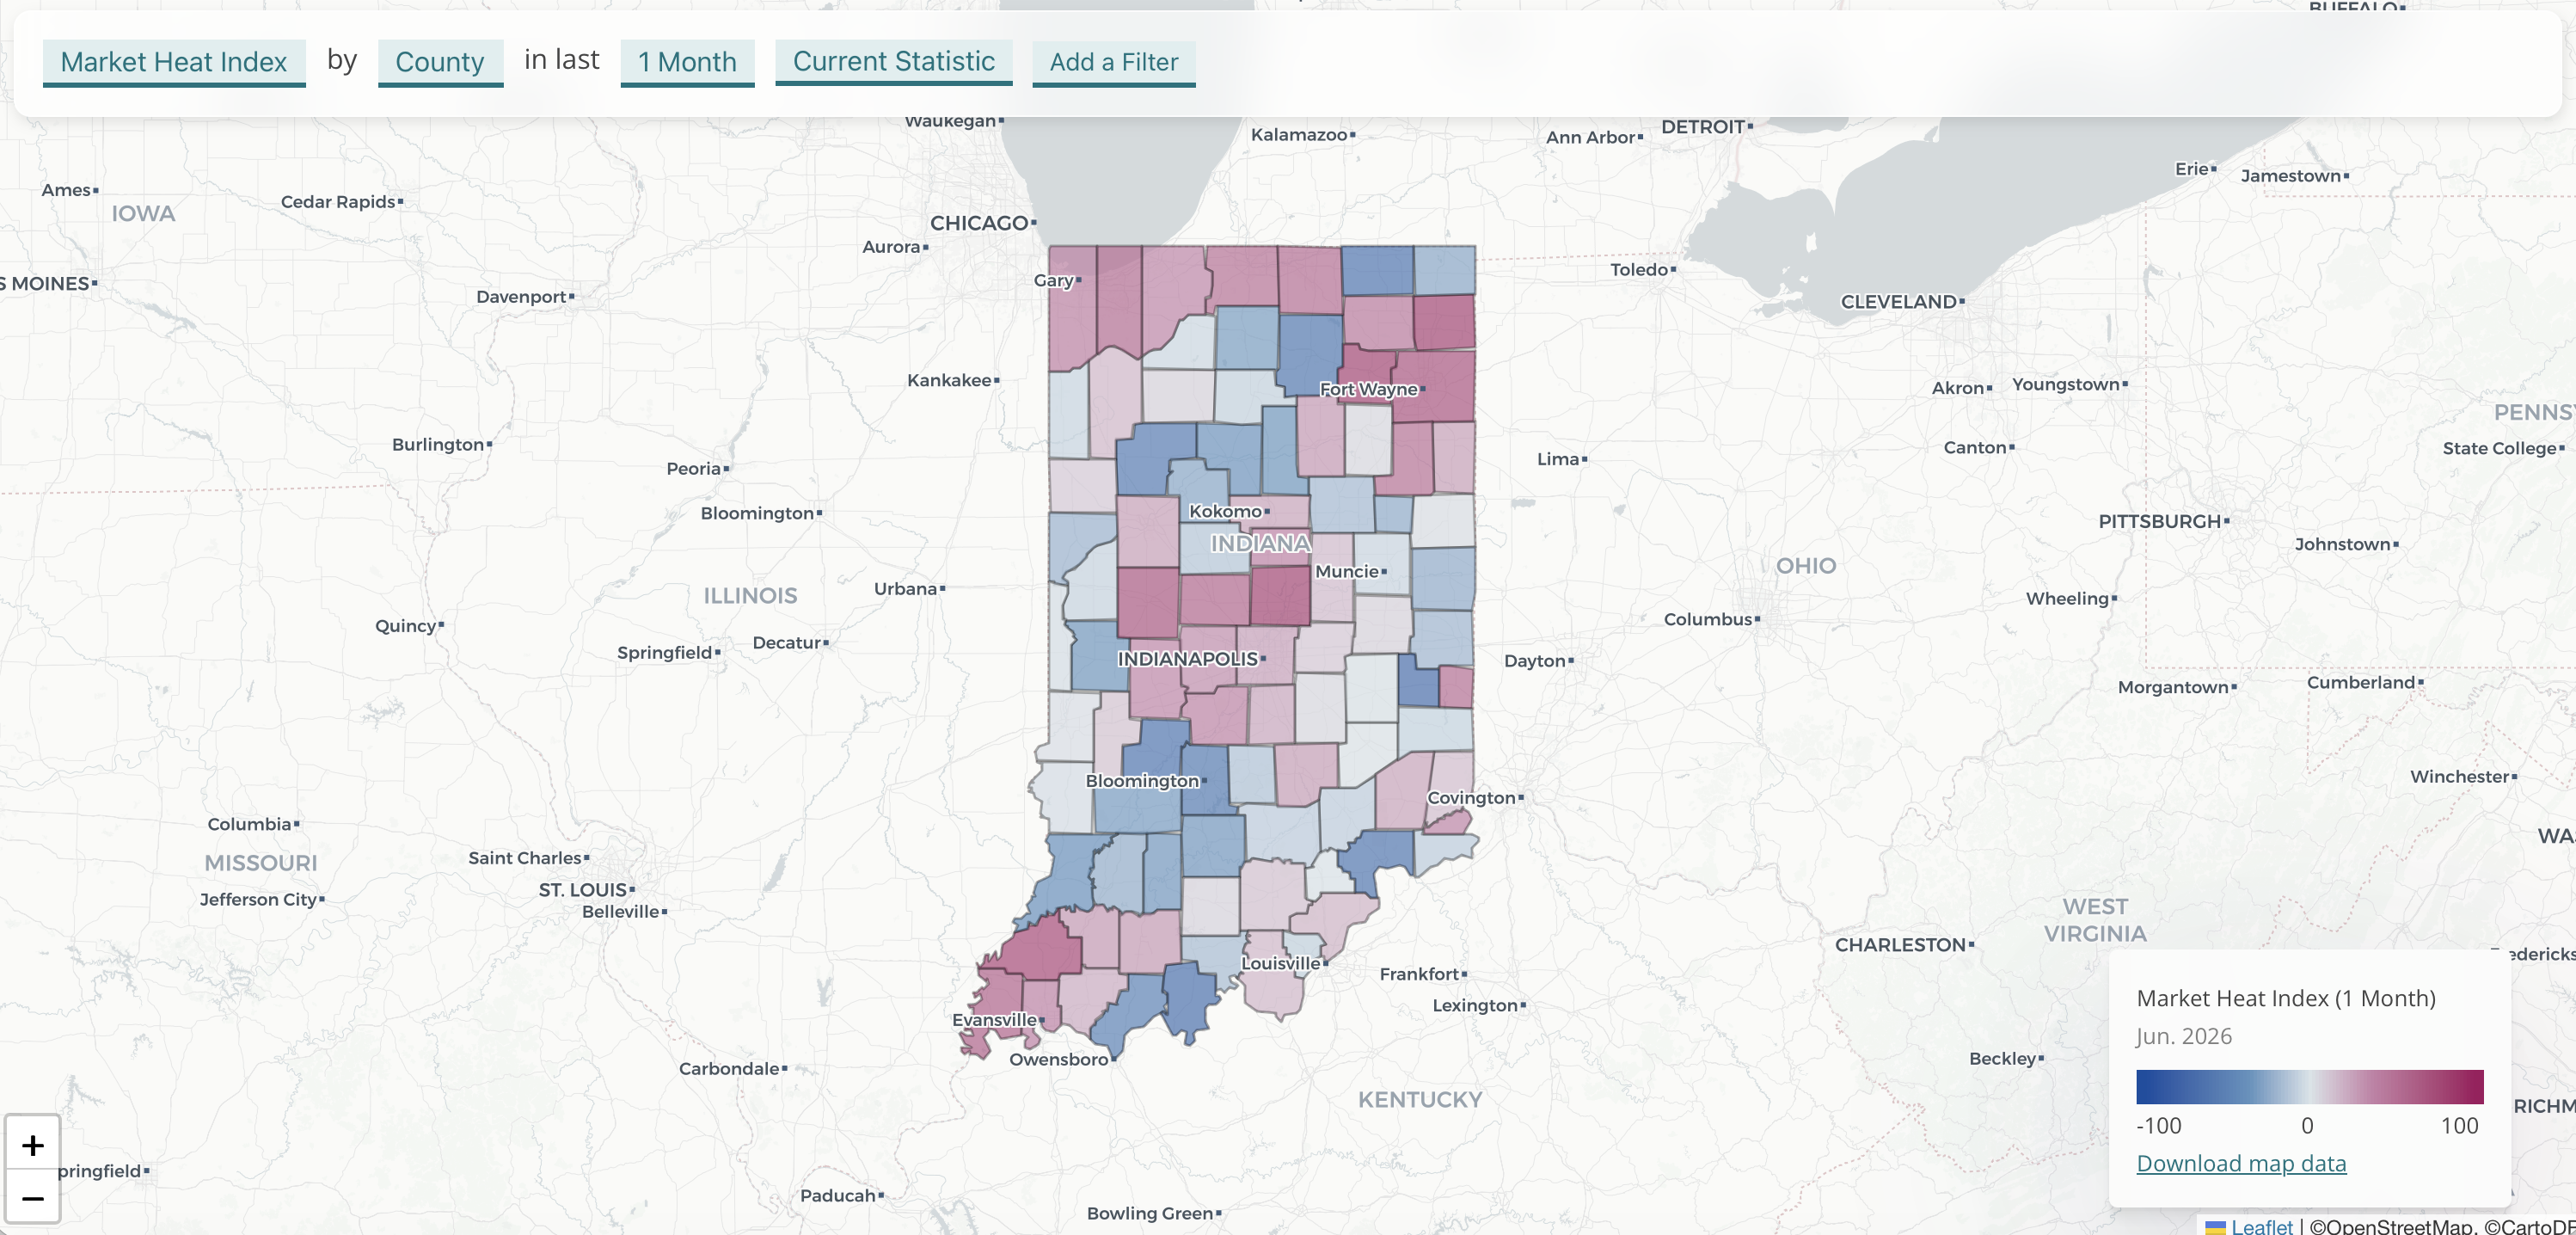
In June, the hottest markets (pink) are generally in Northern Indiana and the Fort Wayne, Indianapolis, and Evansville metro areas.
The Market Heat Index combines three things: how fast homes are selling (days on market), what share of asking price sellers are getting (sale-to-list ratio), and how quickly new listings are being absorbed into contracts. Each of those components gets scored relative to the other markets in the state, and the scores are blended into a single number. A score above zero means the market is running hotter than the rest of the state: more competitive, faster, and tighter on inventory. A score below zero means it's cooler than other markets.
Source: Indiana Association of REALTORS® Market Heat Index · Arrow shows change from same period one year ago
Changes in the State's Hottest Markets
Michigan City went from one of Indiana's cooler markets to its hottest in a year. Sale-to-list price jumped from 95.2% to 98.3%, and for every 100 homes listed, 106 are going under contract. Kokomo made a similar leap, with sale-to-list climbing from 94.9% to 97.3%. Fort Wayne and South Bend are the steadiest hot markets, with homes going under contract in under 10 days and sellers getting more than 98% of asking price.
Some markets that looked strong last year have slowed down. Columbus was absorbing 128 contracts per 100 listings a year ago. That's now 76, and the typical home is sitting 6 more days before going under contract. Lafayette-West Lafayette fell the same way: fewer contracts relative to listings, longer wait times, and buyers negotiating harder. Louisville and Muncie followed the same pattern.
Bloomington is in a different situation than any other market on this list. Only 29 out of every 100 new listings are finding a buyer in a given week, down from 51 a year ago. Homes are sitting nearly 58 days and selling at 94.7% of list price. Supply is outrunning demand by a wide margin.
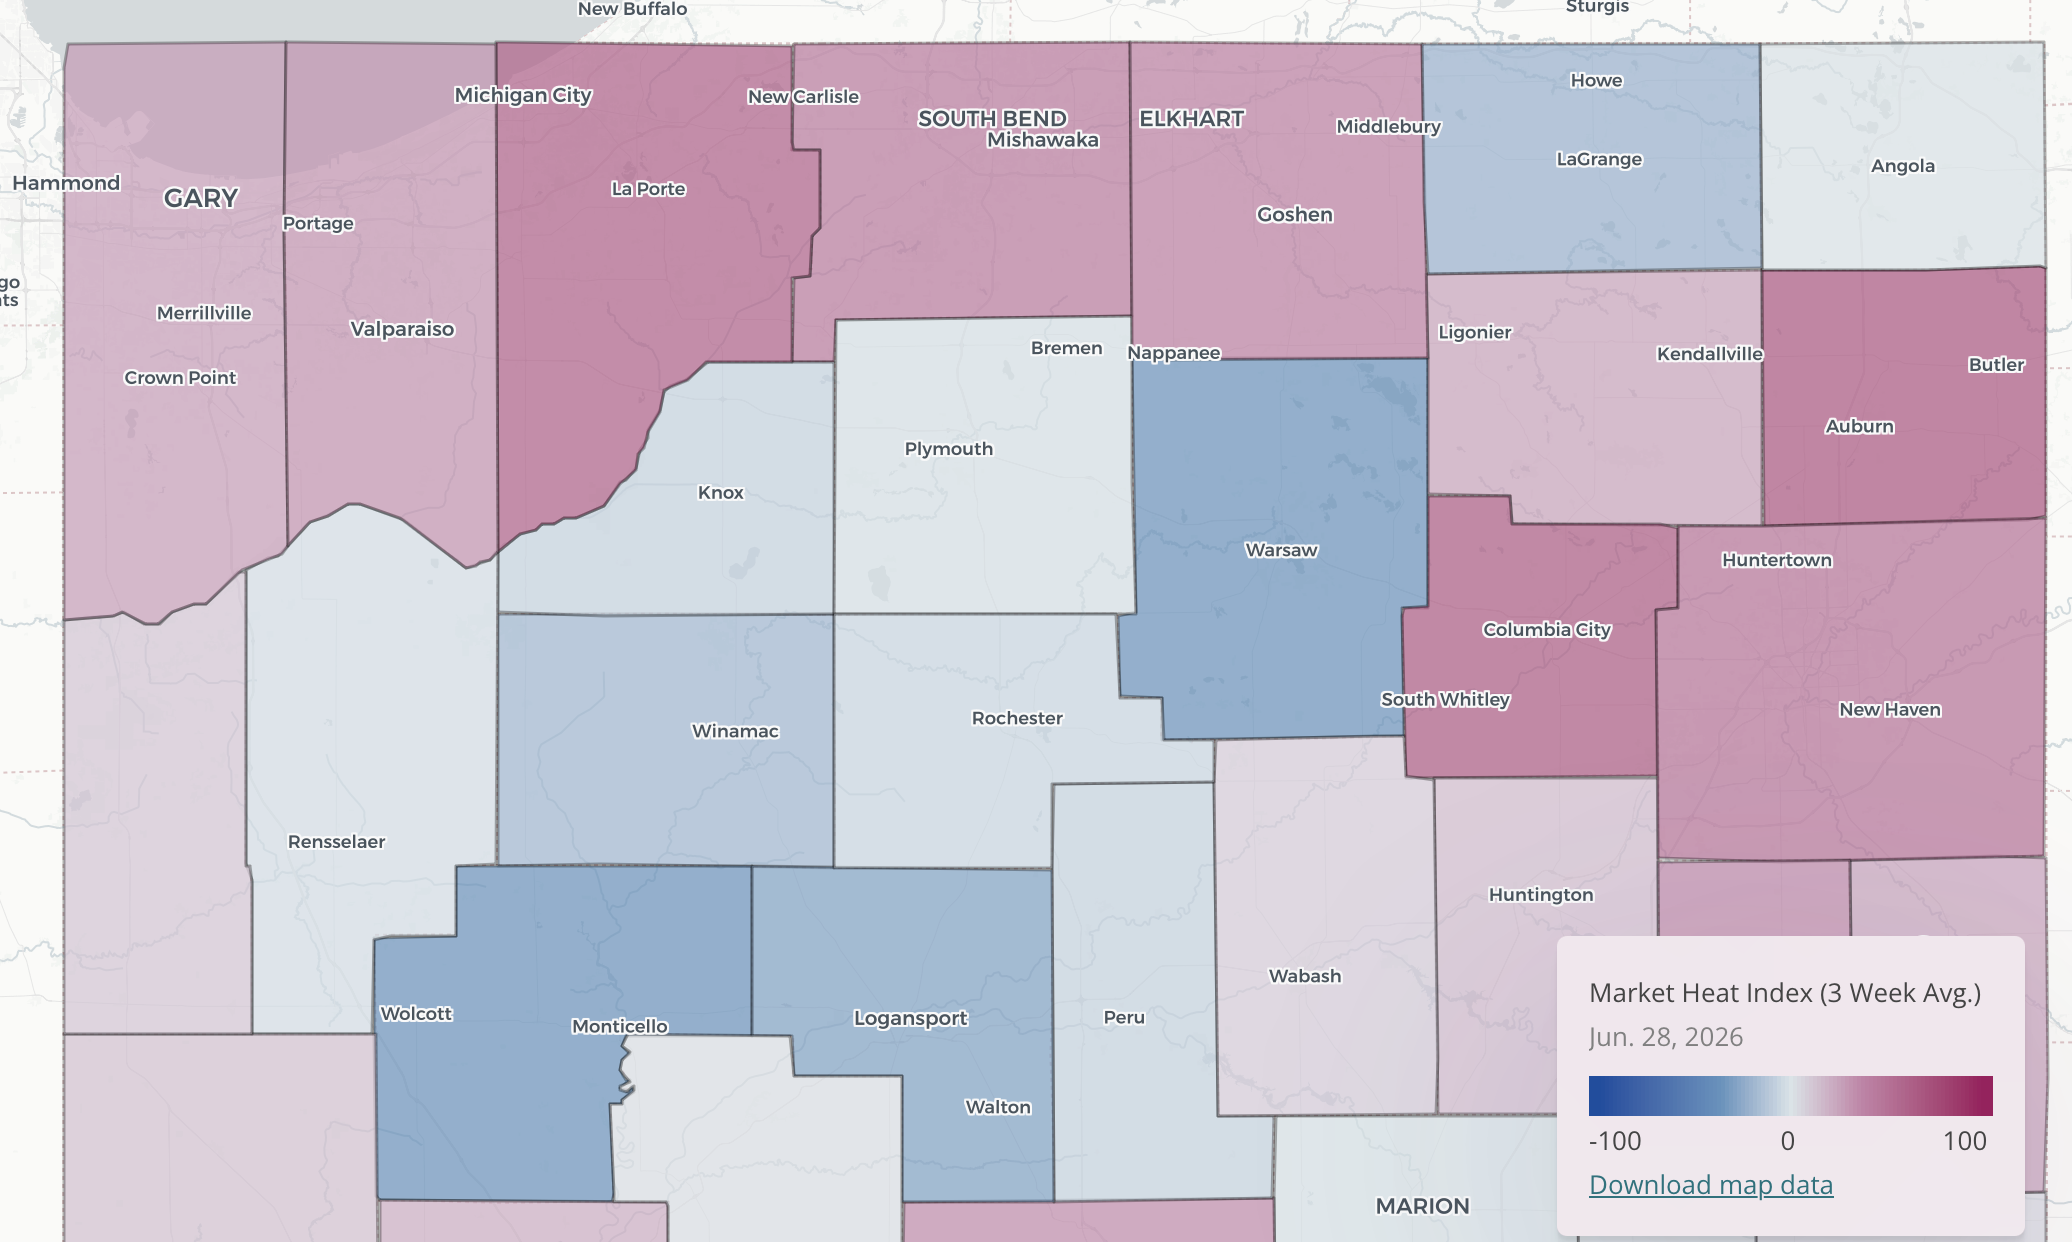
The hottest markets in the state are in Northern Indiana. Michigan City leads the index at 60, with 1.06 contracts signed for every new listing that came on in the past three weeks. With more demand than supply, buyers are paying over 98% of asking price. Fort Wayne sits at 49 overall, but Whitley County on the metro's edge absorbed at 1.56, meaning listings are disappearing faster than they arrive. South Bend and Elkhart round out the northern tier at 44 and 41.
Indianapolis reads as a warm market at 35, but that number covers up a lot of variation between counties. Hamilton County is at 58 with an 85-contract-per-100-listings pace (fast but still building inventory). Sellers are accepting offers after 12 days, and buyers are paying 98.6% of asking. The outer counties tell a different story: Brown County is at -18 with 65-day DOM, though even there, absorption is running close to 1.0, which means inventory isn't piling up.
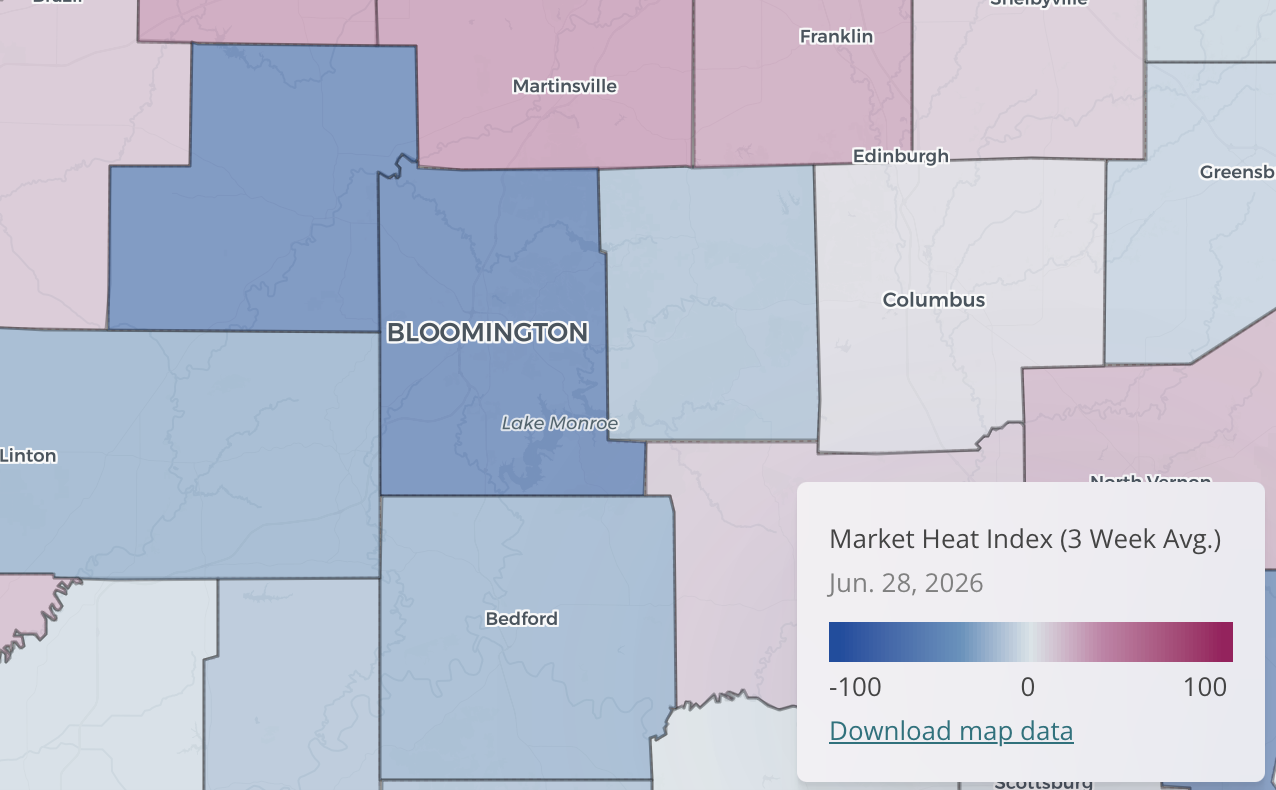
Bloomington is in a different situation than anywhere else on this list. Its absorption rate over the past three weeks was only 29 contracts for every 100 new listings. Inventory is accumulating, median DOM is nearly 58 days, and homes are selling at 94.7 cents on the dollar.
For an even more detailed look at specific markets, explore this township-level map or visit our Markets tool to build a neighborhood snapshot.