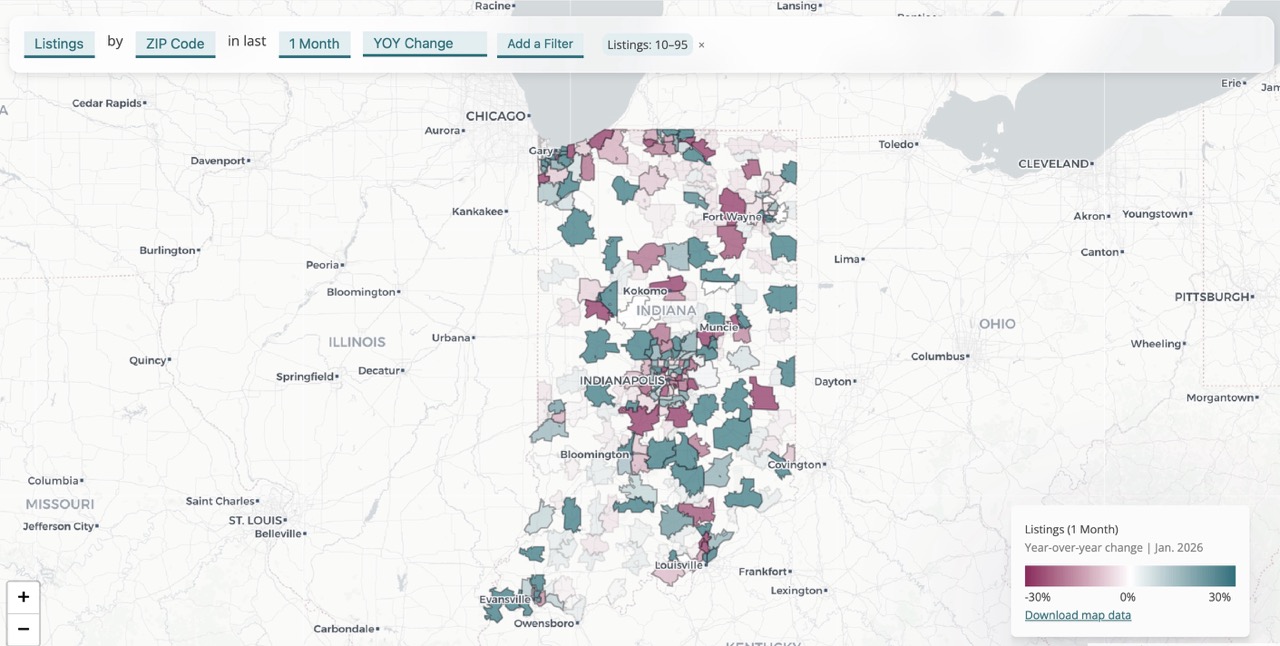
There are over 100 ZIP Codes that had at least 10 listings in January and had more listings than last January. In this week's edition of the Monday Map, we dive into those ZIP Codes.
In these maps, green ZIP Codes have positive YOY listing growth. Faded ZIP Codes had fewer than 10 listings in January.
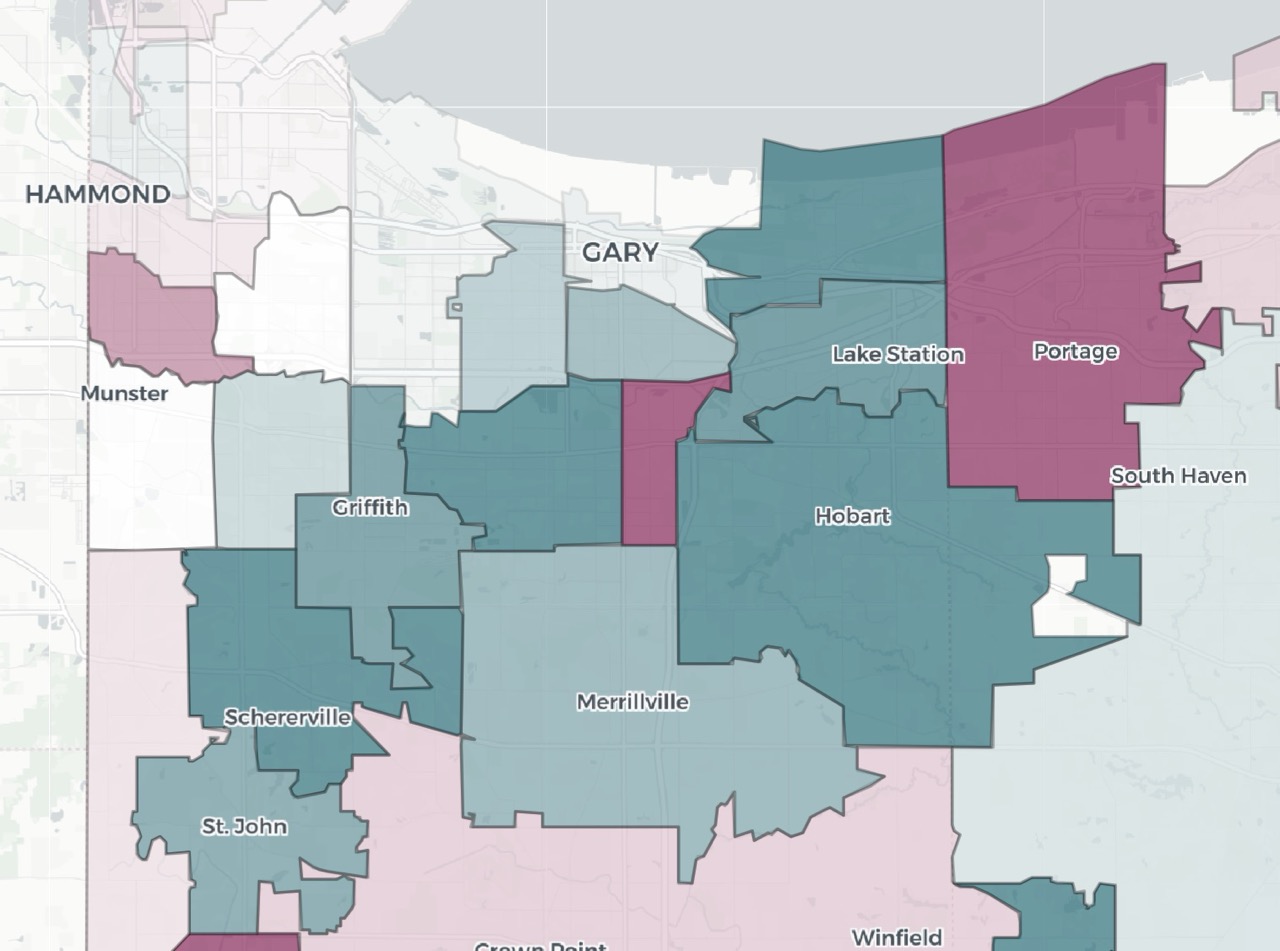
Most ZIP Codes in Northwest Indiana have growing listings. Near Hobart, 46342 had 40 listings, 90% higher than last January. Schererville (46375) is up 58%. Portage (46368) is an exception, with listings down 45%.
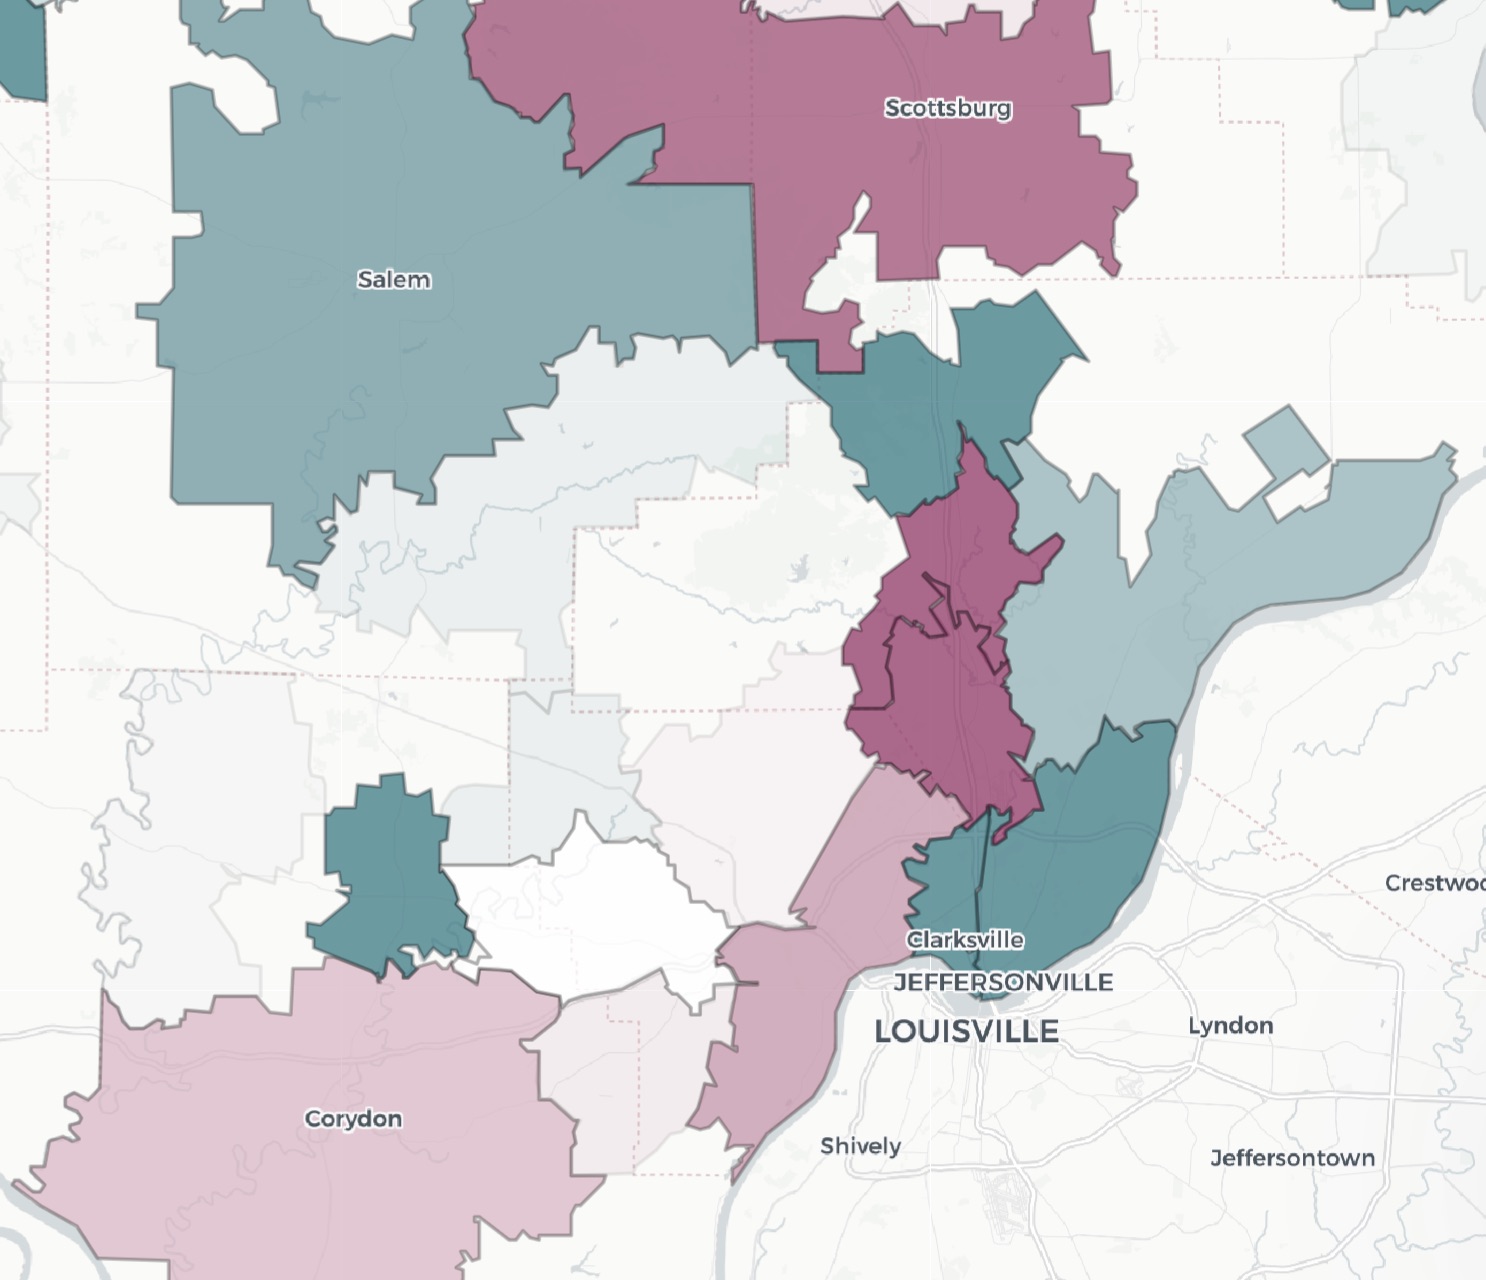
In the Louisville Metro Area, listings signals are mixed. Clarksville and Jeffersonville listings are booming: 47130 is up 51%, and 47129 is up 81%. Salem and Henryville also have more listings than last January. Corydon, Sellersburg, and New Albany, however, have fewer listings than January 2025.
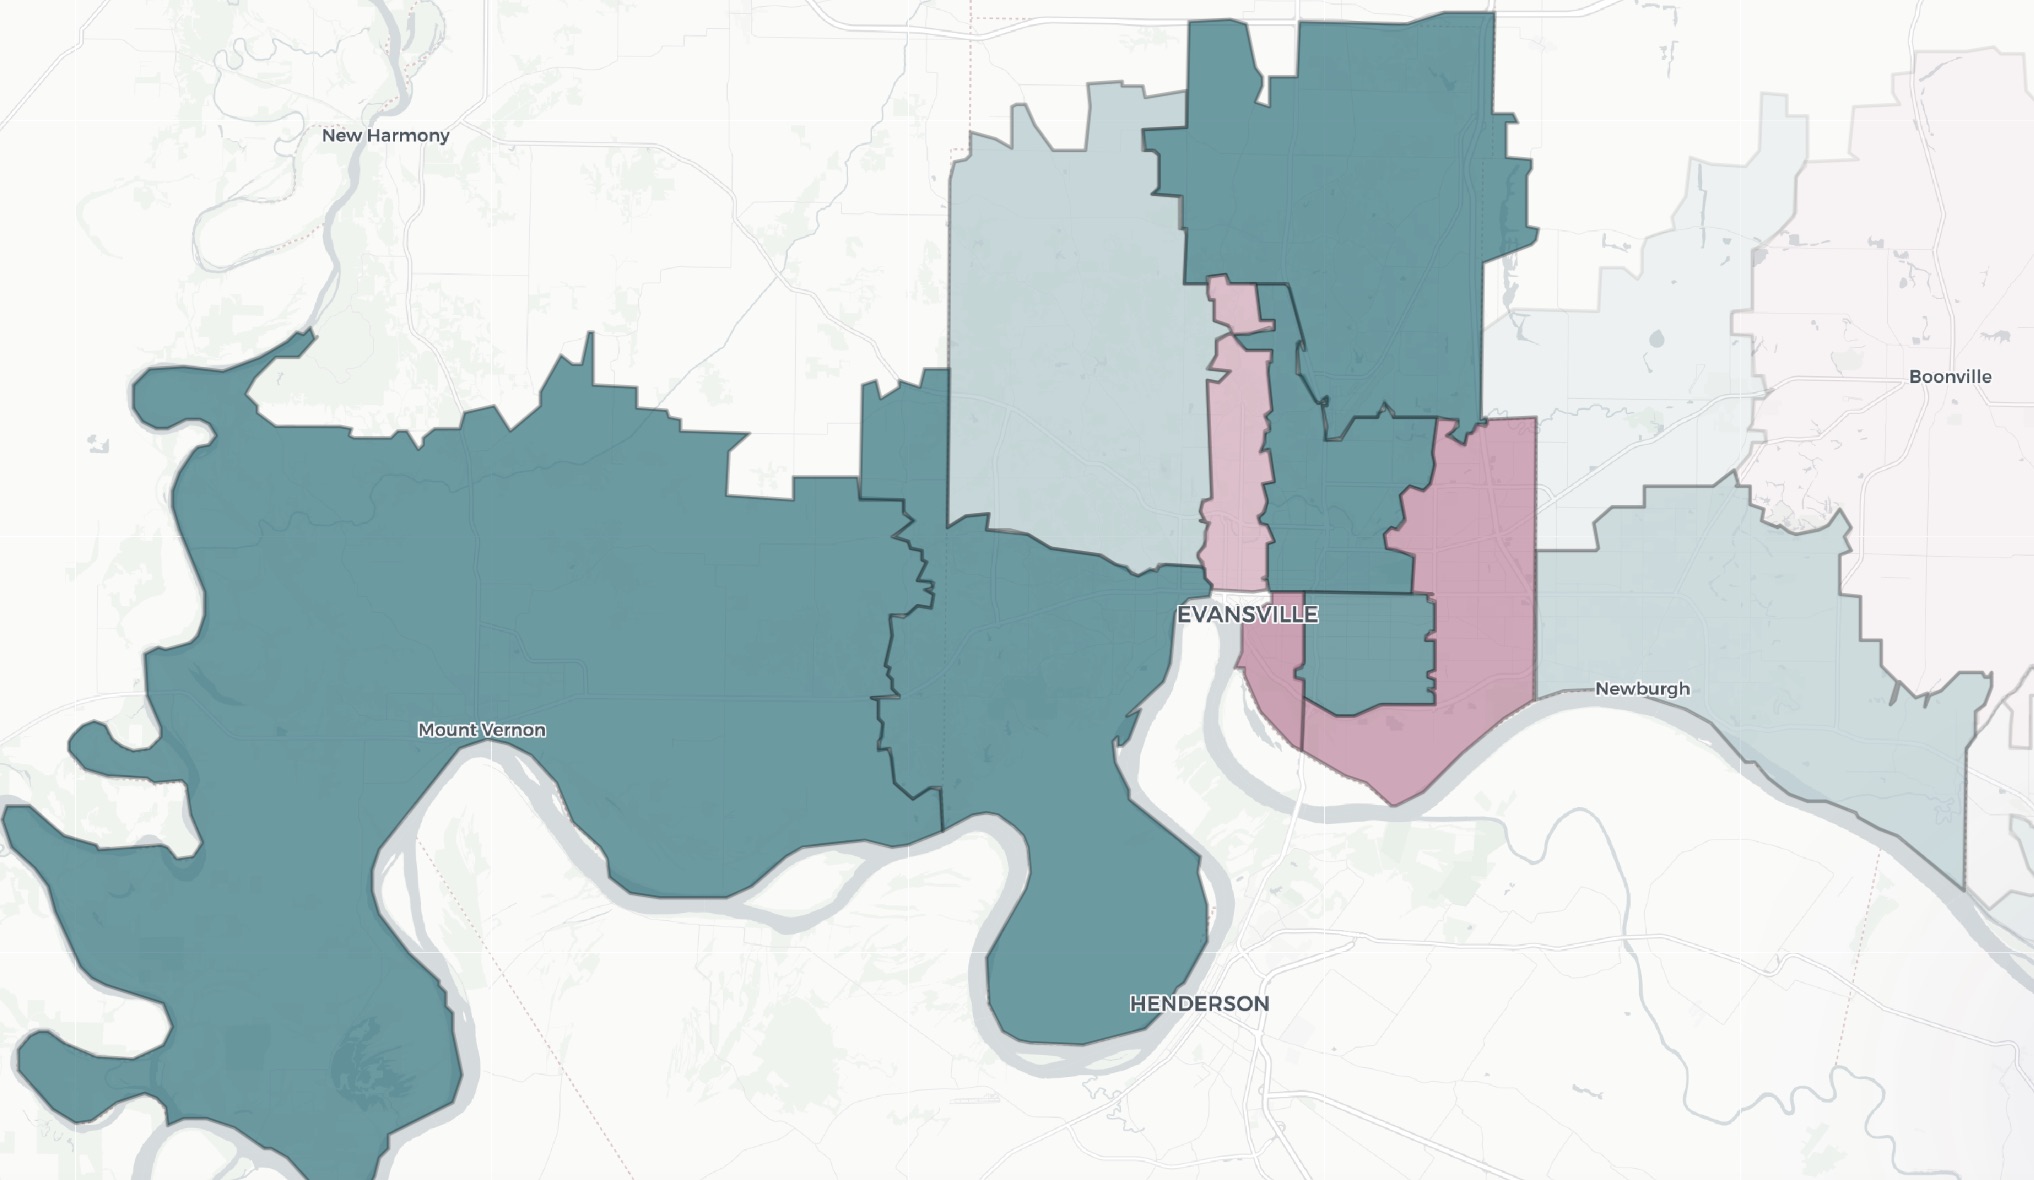
In Evansville and the surrounding counties, nearly every ZIP Code has year-over-year growth in listings. In 47725 and 47712, listings are double their January 2025 totals. In 47630, they are up 10%. West of the city, 47620 had only 14 listings, but that is nearly three times the January 2025 total.
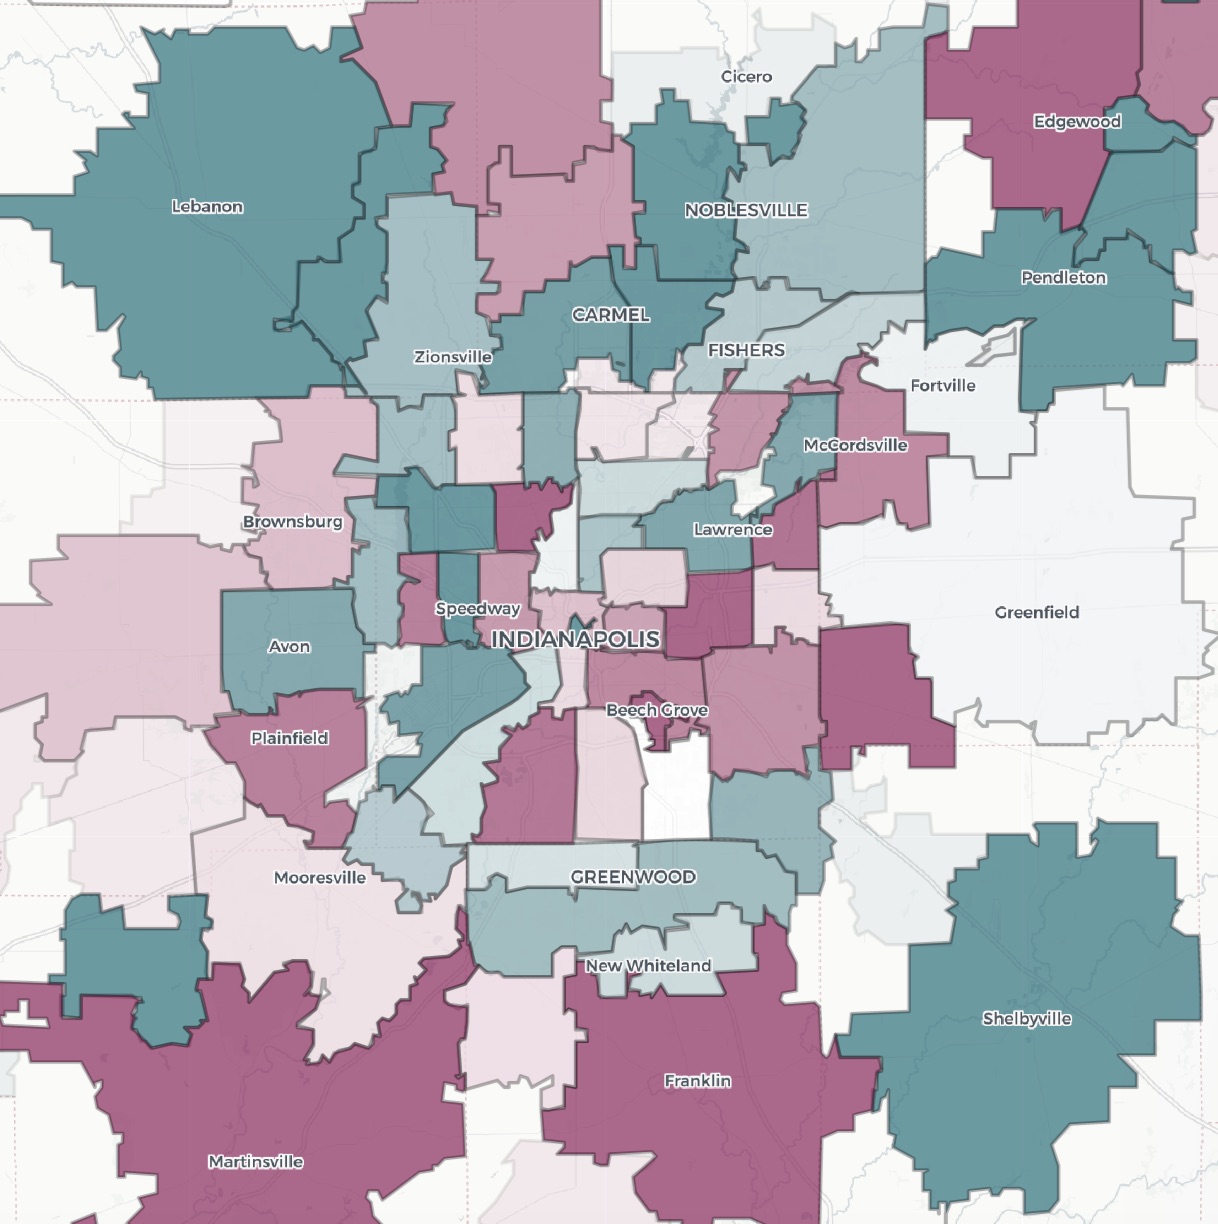
In Indianapolis, the Northeast Side and West Side tend to have growing seller activity. In Lawrence, 46226 is up 26%. In Speedway, 46224 is up 88%. Downtown Indianapolis, with only 11 listings, is still up 57% compared to last January.
Almost all northern suburban ZIP Codes have more sellers entering the market than last January. In Zionsville, 46077 is up 18%, and in Carmel, 46032 is up 28%. The growth in Fishers is more moderate, but is still 12%-15%.
If your market wasn't listed here, click here to open the map and find your ZIP Code.