
We forecast the state needs to double the rate of construction to meet housing needs by 2029.

The market has slowed, but not for everyone. Correctly priced homes still go under contract in about a week. The slowdown is concentrated in mispriced listings.

Indiana sellers see 5.4% annual appreciation in Q1 2026
 The Monday Map for May 19, 2025
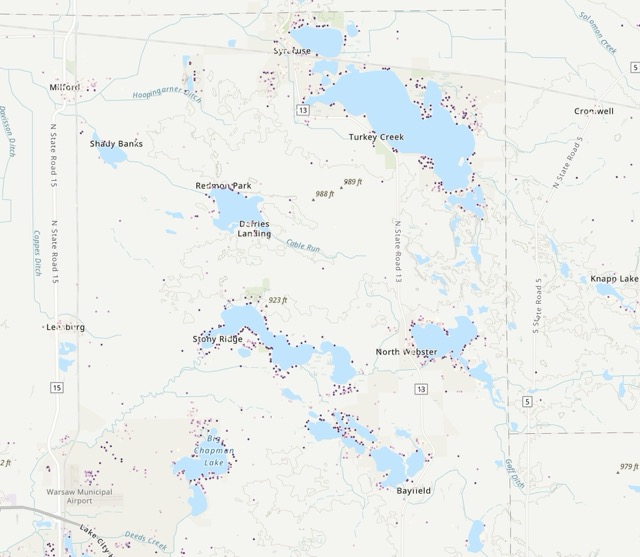 We analyzed 10,000 home sales and found that lakes have the strongest effect on prices, followed by streams, parks, and trails.
 The Monday Map for April 28, 2025
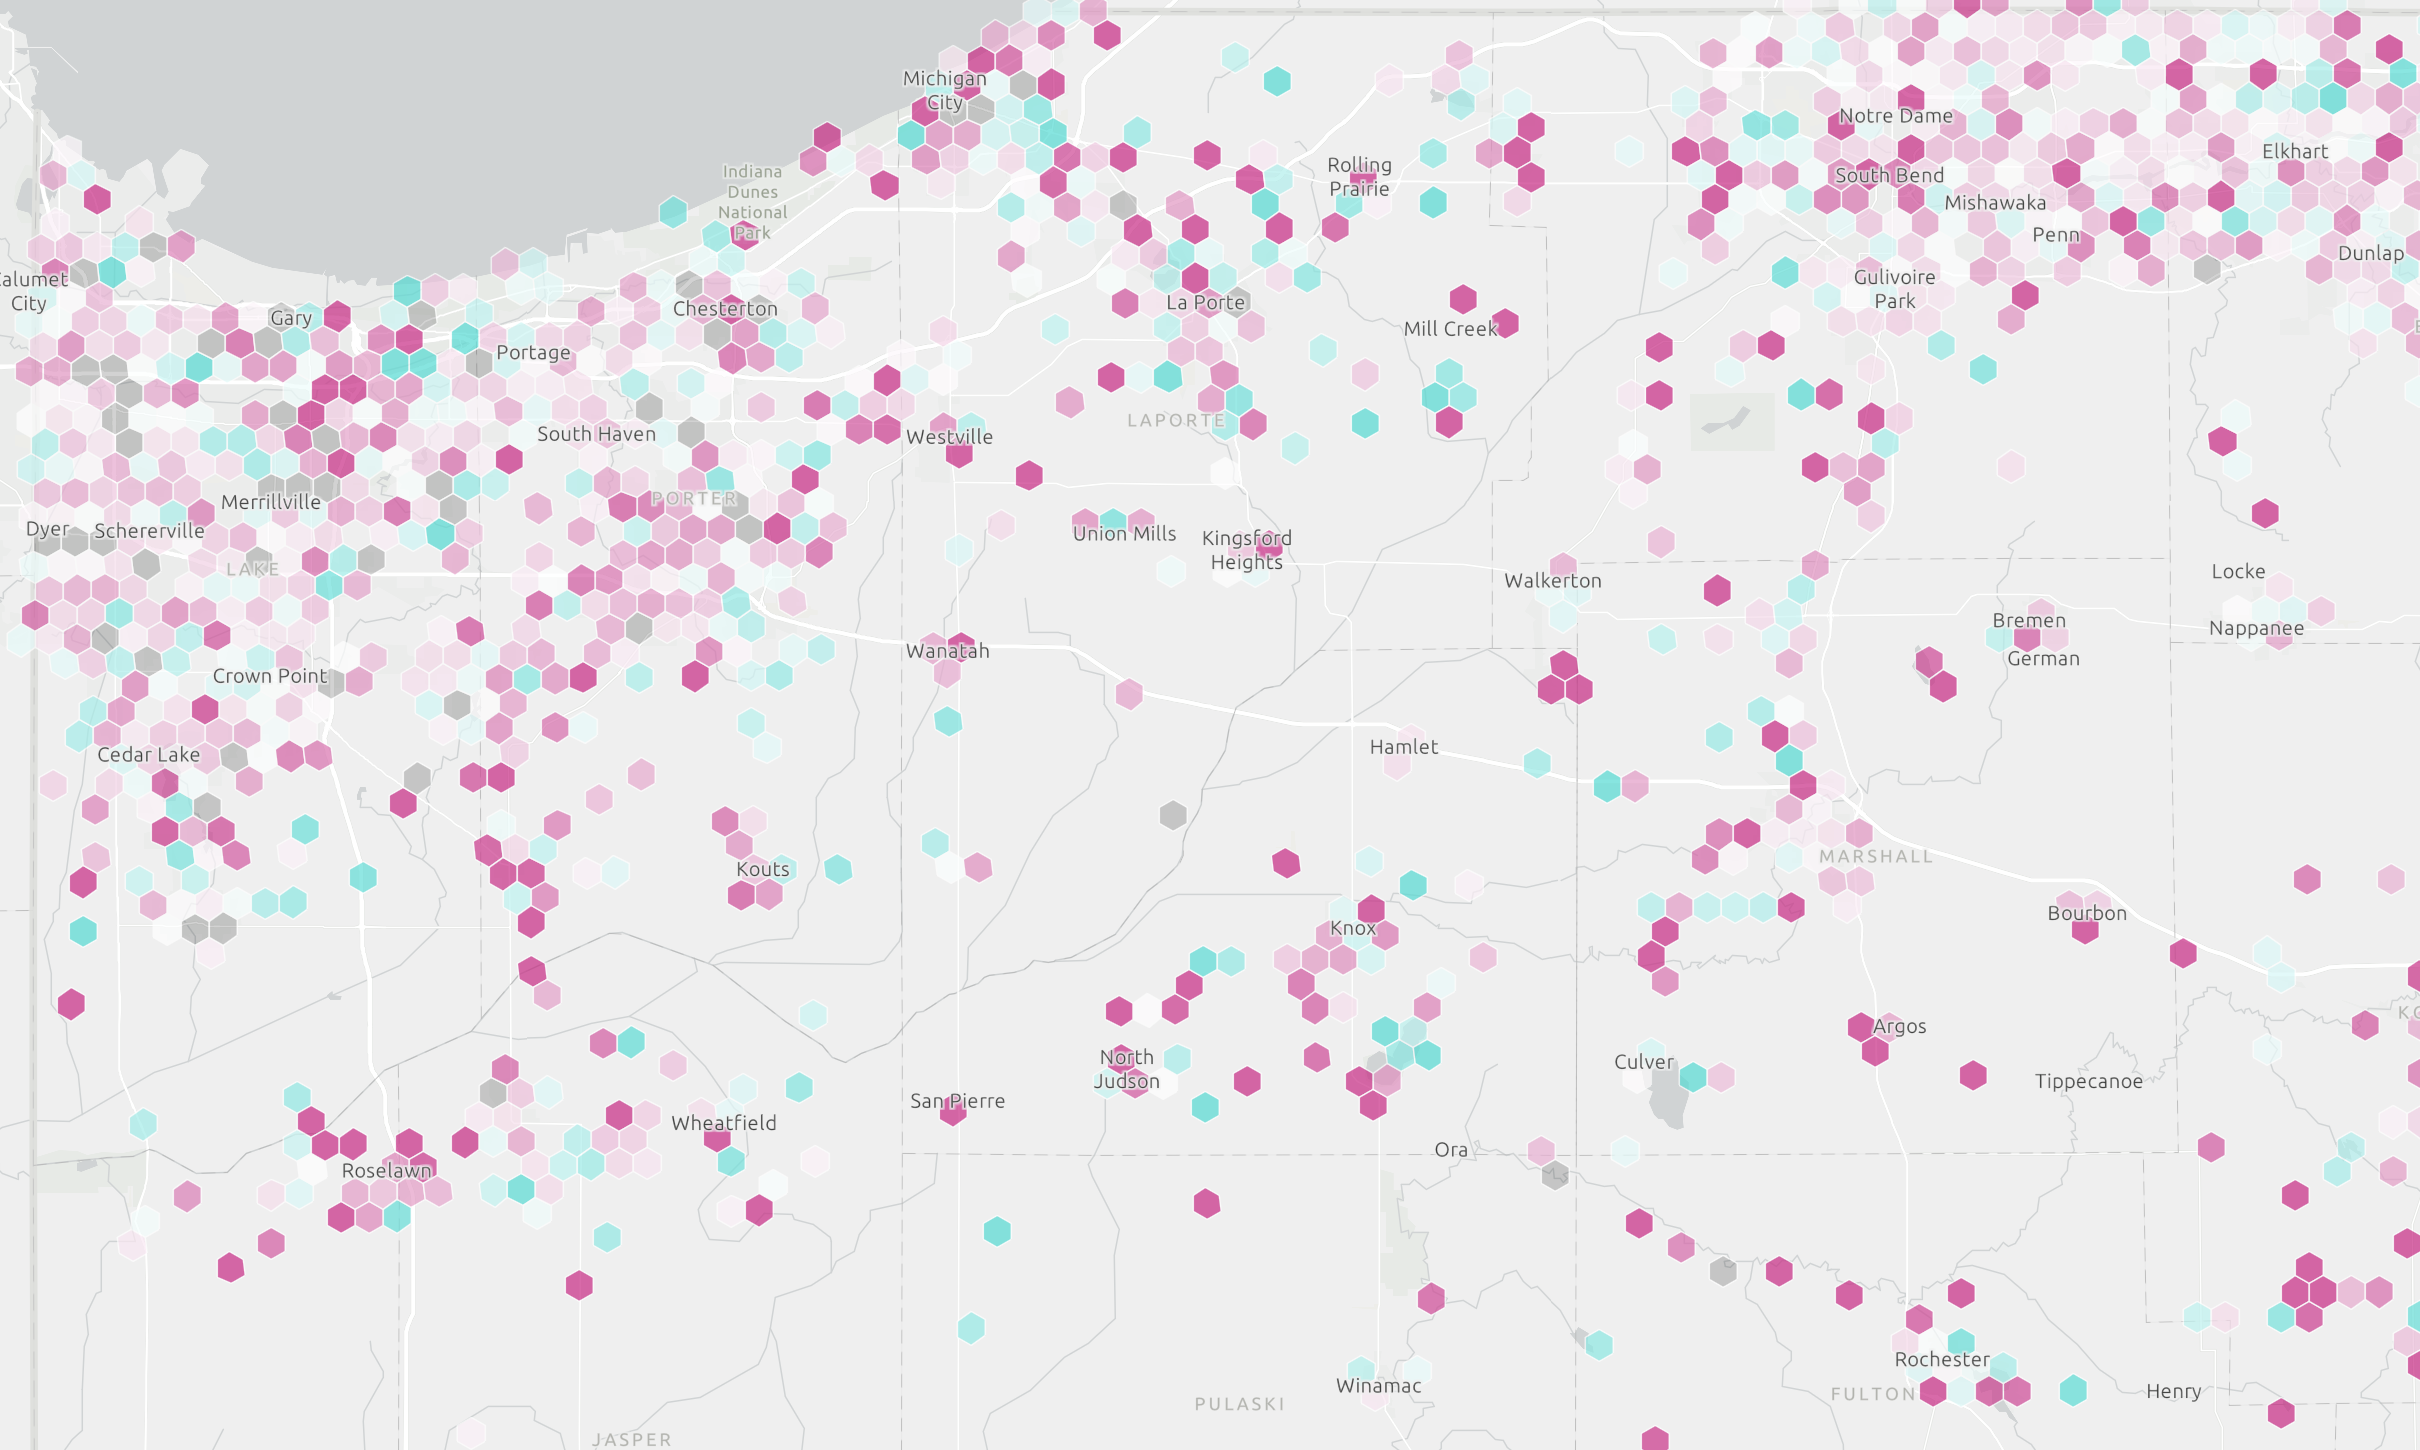 This interactive map shows how prices have changed in half-mile neighborhood areas.
 The Monday Map for April 21, 2025
 The Monday Map for April 14, 2025
 In the year's bests week of new pending sales, five out of six large metros saw year-over-year growth.
 New pending sales are catching up to last year's numbers in the last three weeks.
We link sales over time to accurately measure price appreciation. Sellers in the three months ending in February enjoyed 6.7% annual appreciation, down from 6.8% in January. Low-cost homes have stronger price growth than high-priced homes.
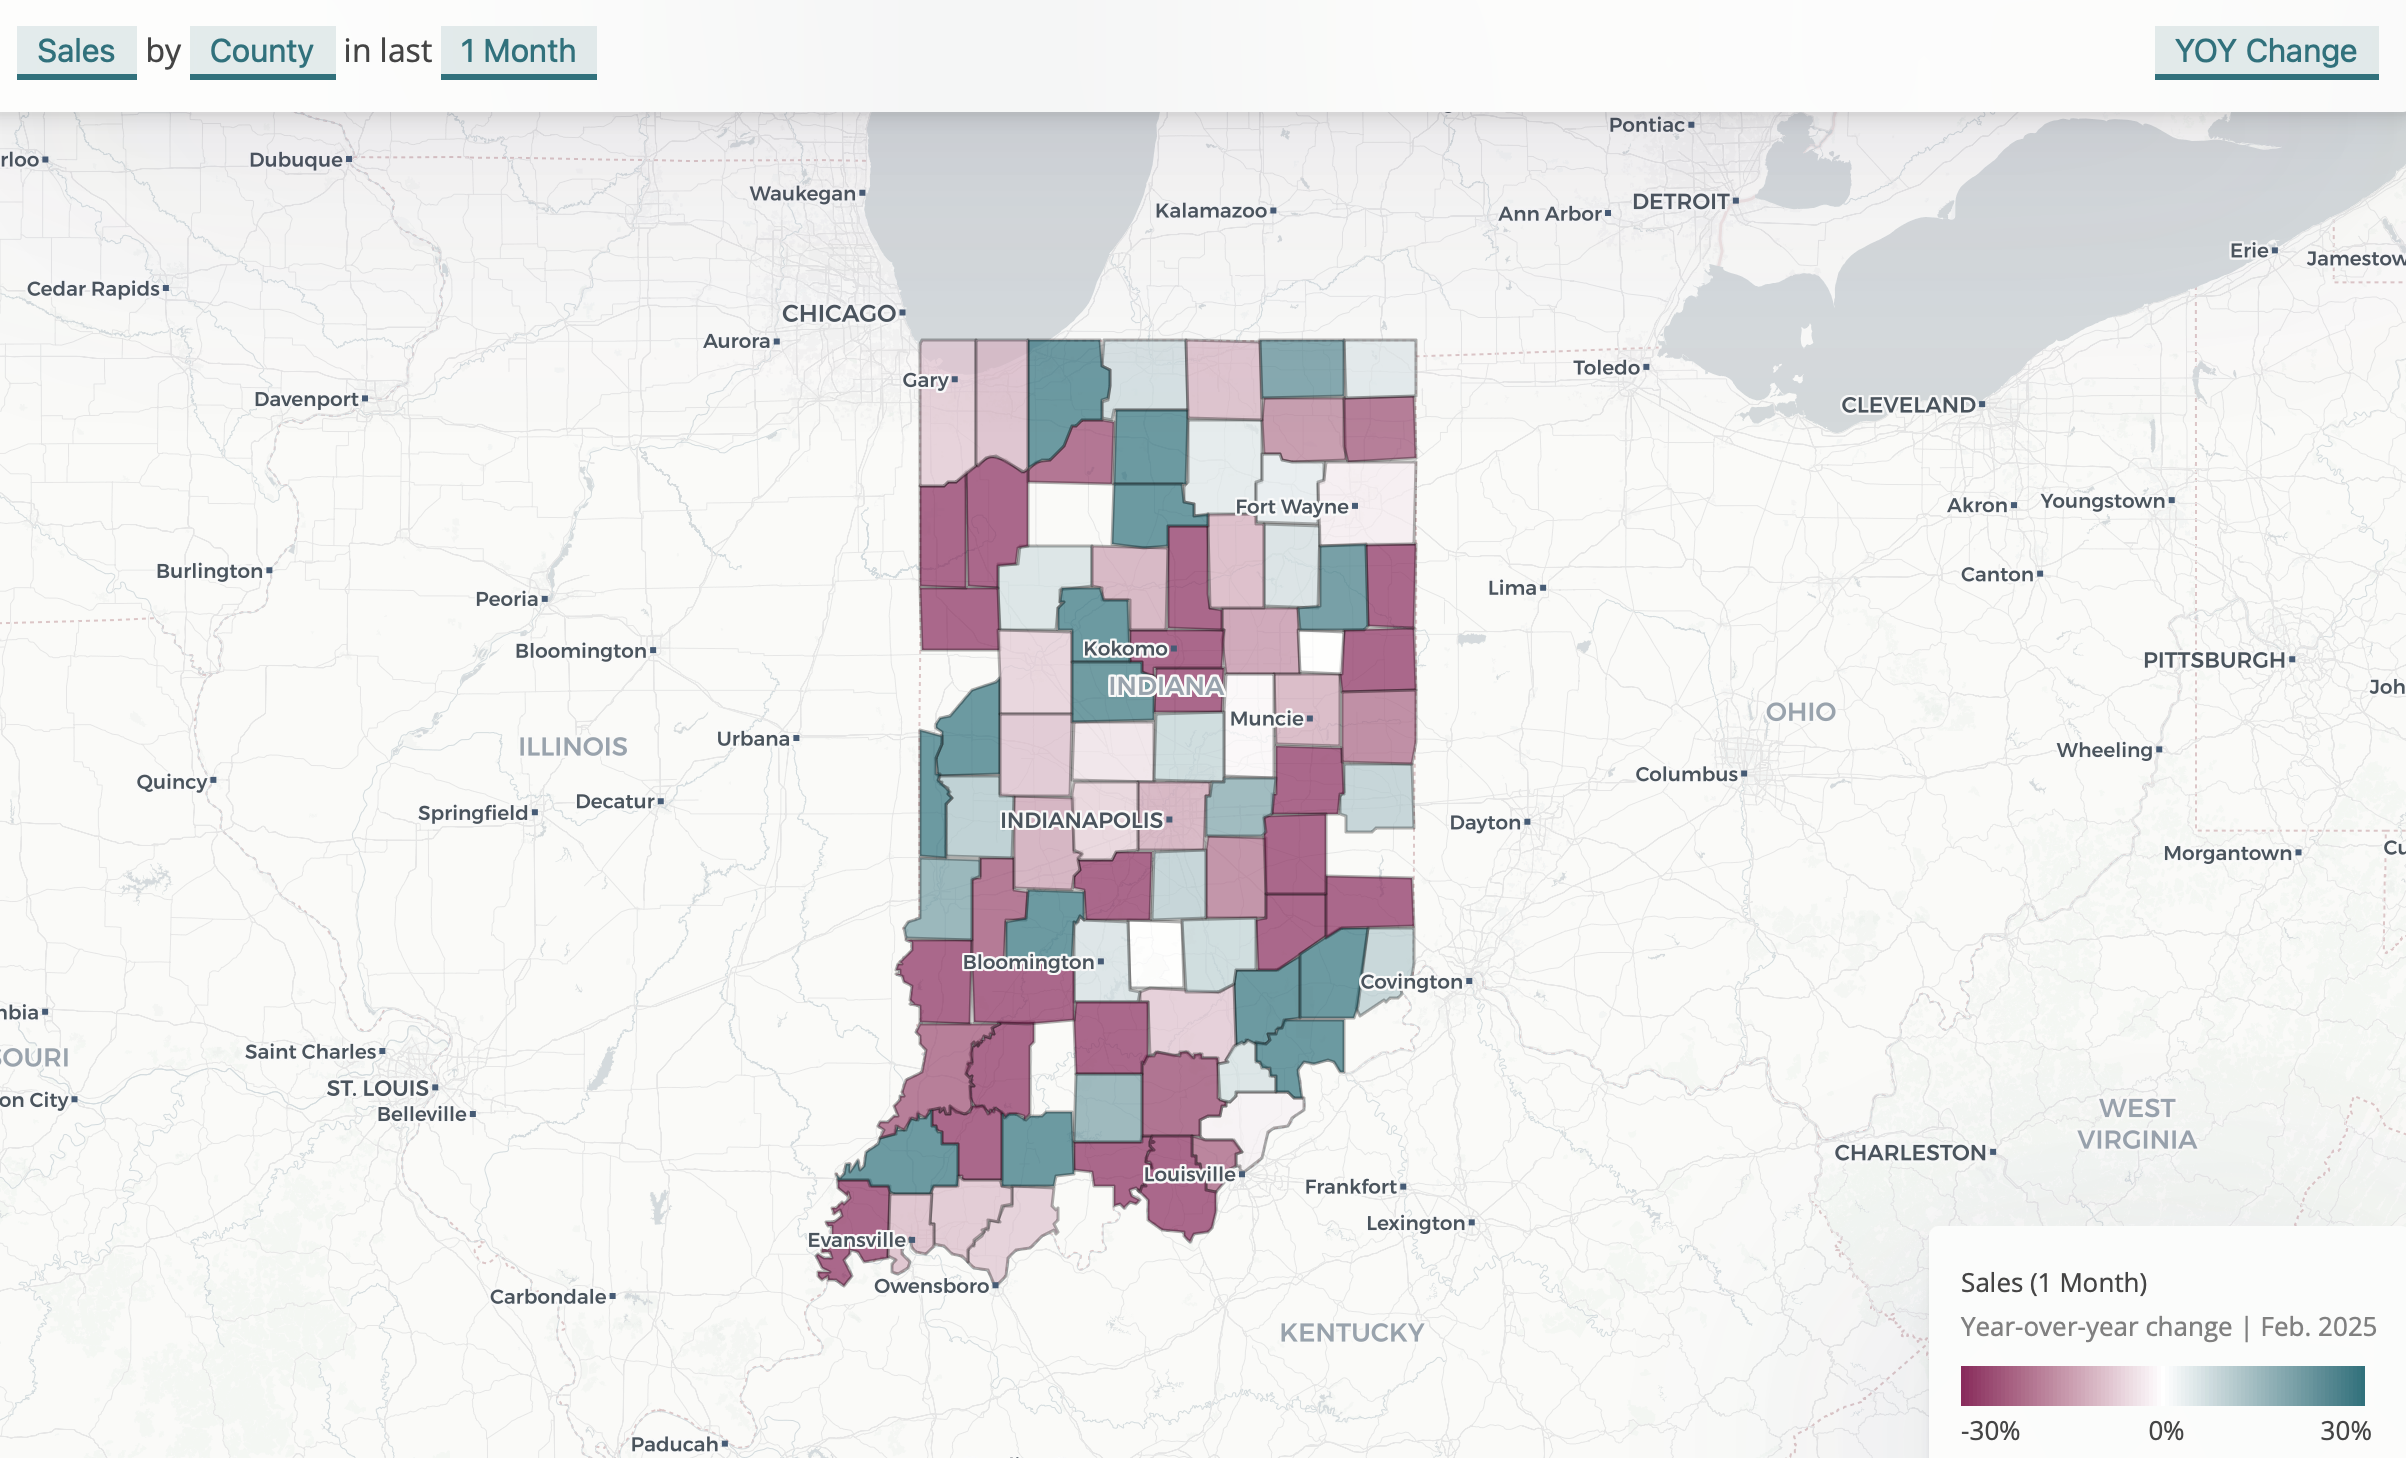 Suburban sales held up better than statewide sales last month. That was driven by three large and high-performing counties: Hendricks, Johnson, and Hamilton.