
We forecast the state needs to double the rate of construction to meet housing needs by 2029.

The market has slowed, but not for everyone. Correctly priced homes still go under contract in about a week. The slowdown is concentrated in mispriced listings.

Indiana sellers see 5.4% annual appreciation in Q1 2026
Monday Map, October 13, 2025
Monday Map, October 6, 2025

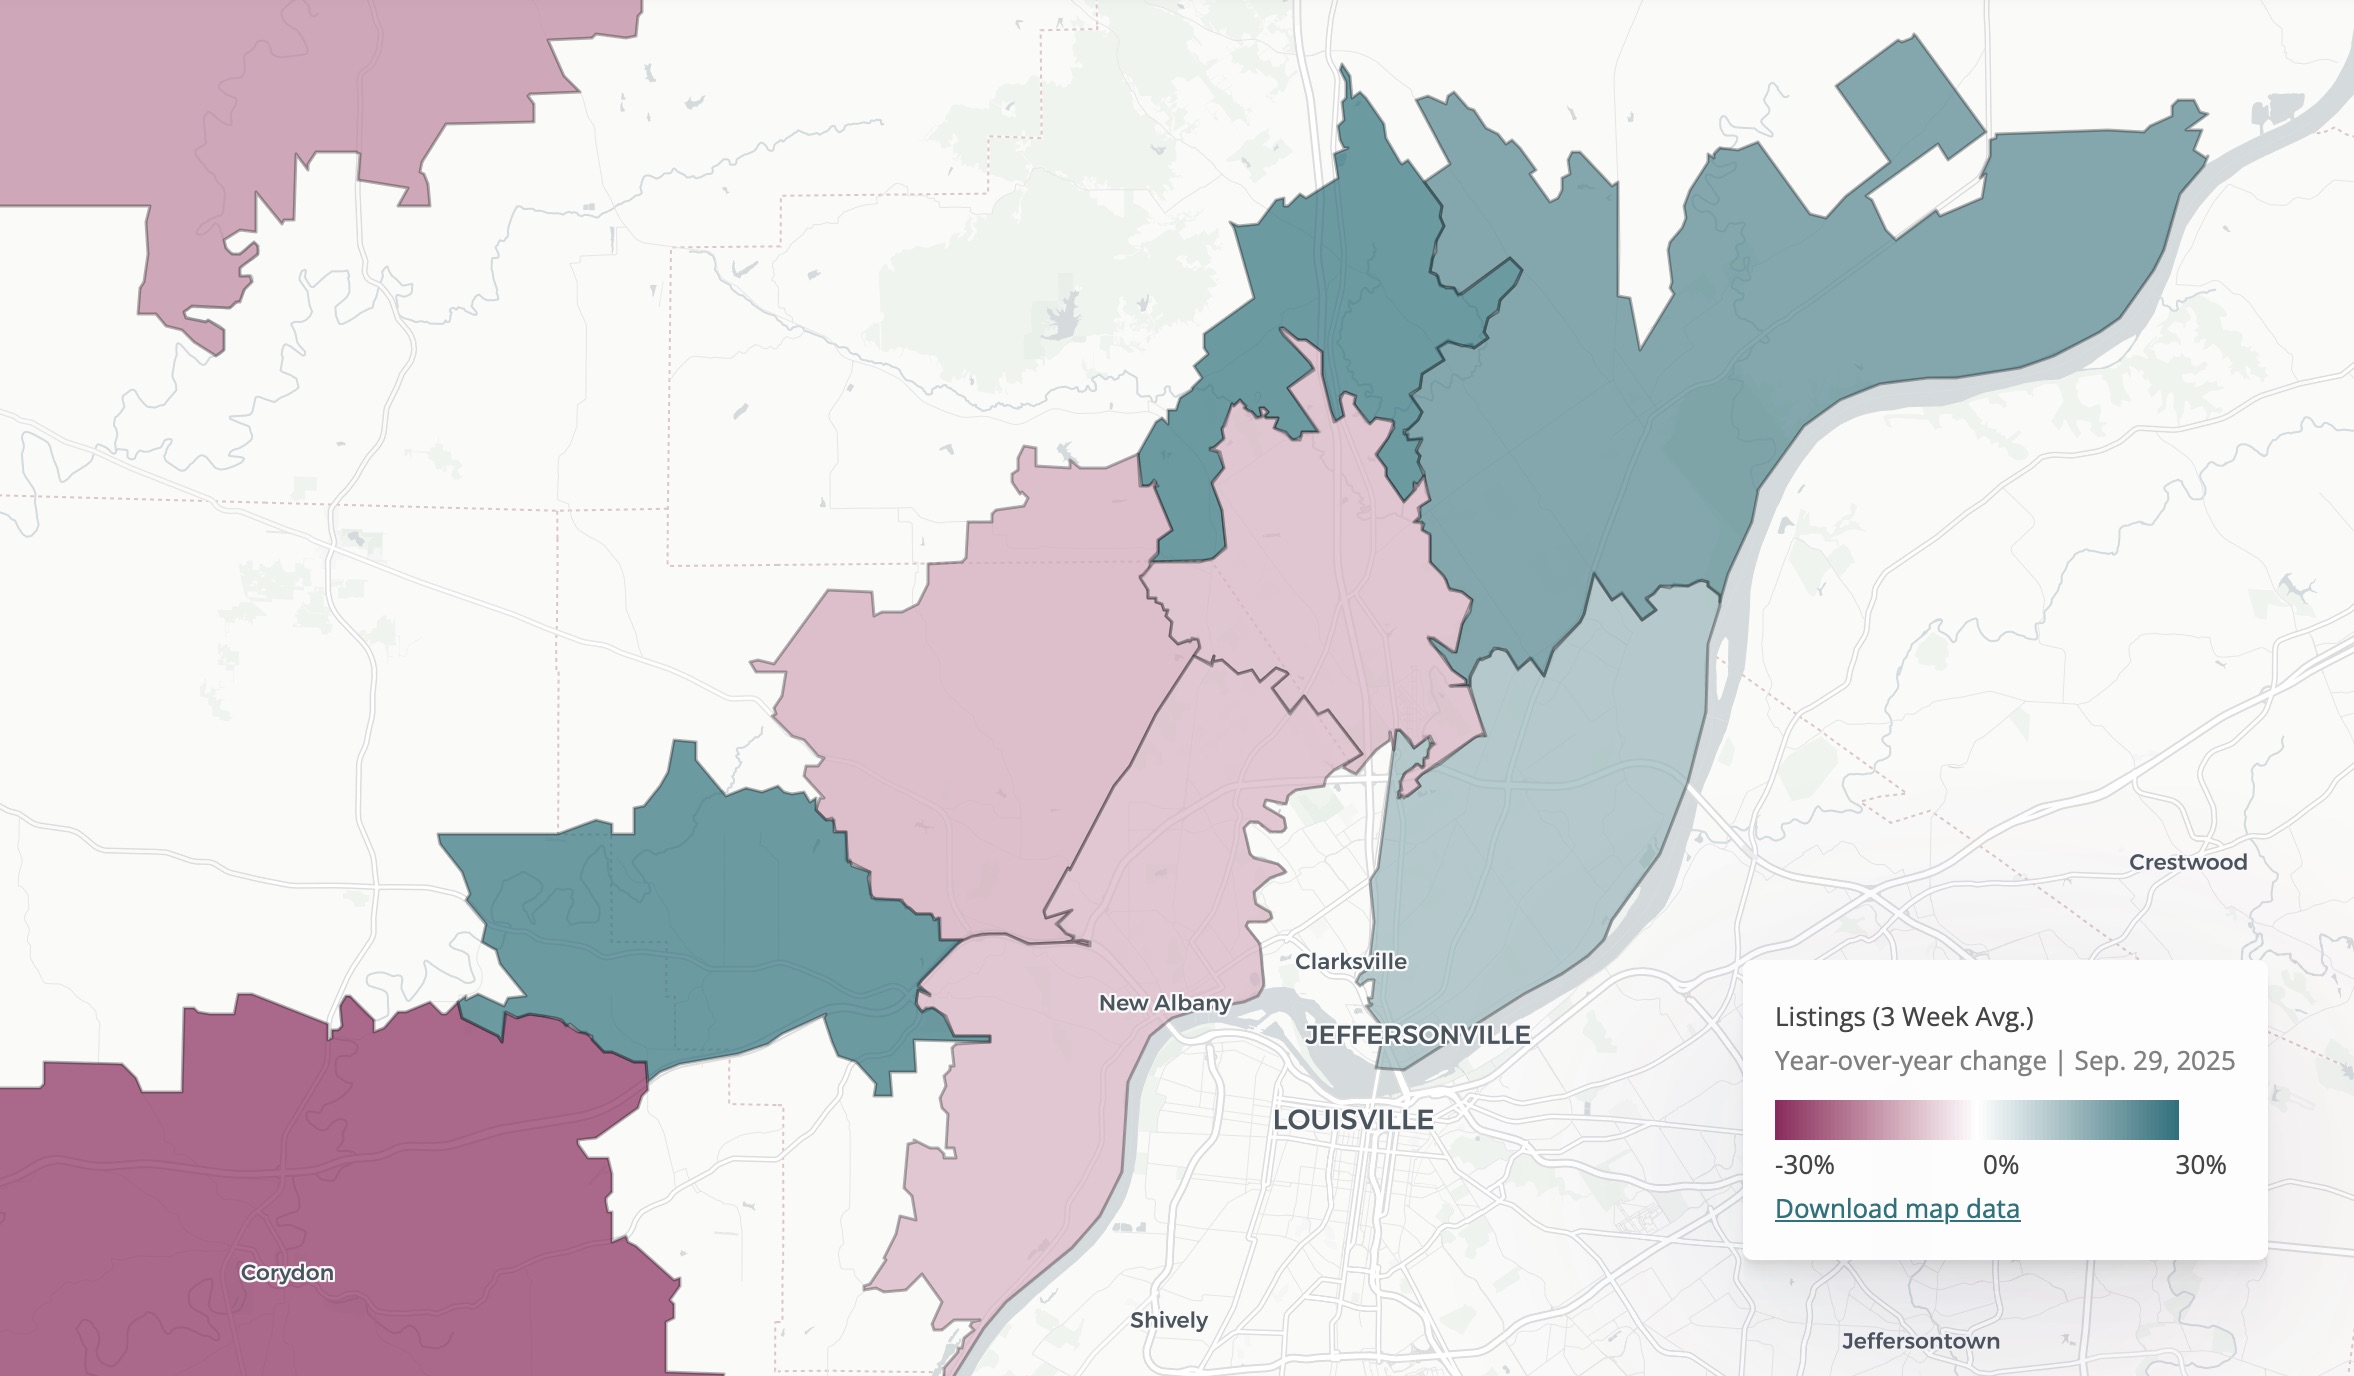
Monday Map, Sep. 29, 2025

Monday Map, September 22, 2025

What is the median monthly mortgage payment in your market, and how does it compare to incomes?

We're six months in. Here's where the market stands and how it's changed since last year.

The Monday Map for July 14, 2025

We took a look at the latest 3-week average for percent of list price received and picked out the ZIP codes with the highest percentages in each major metro.
The Monday Map for May 9, 2025

Roughly 40% of Indiana home listings are affordable to households earning $75,000 - nearly double the national rate.