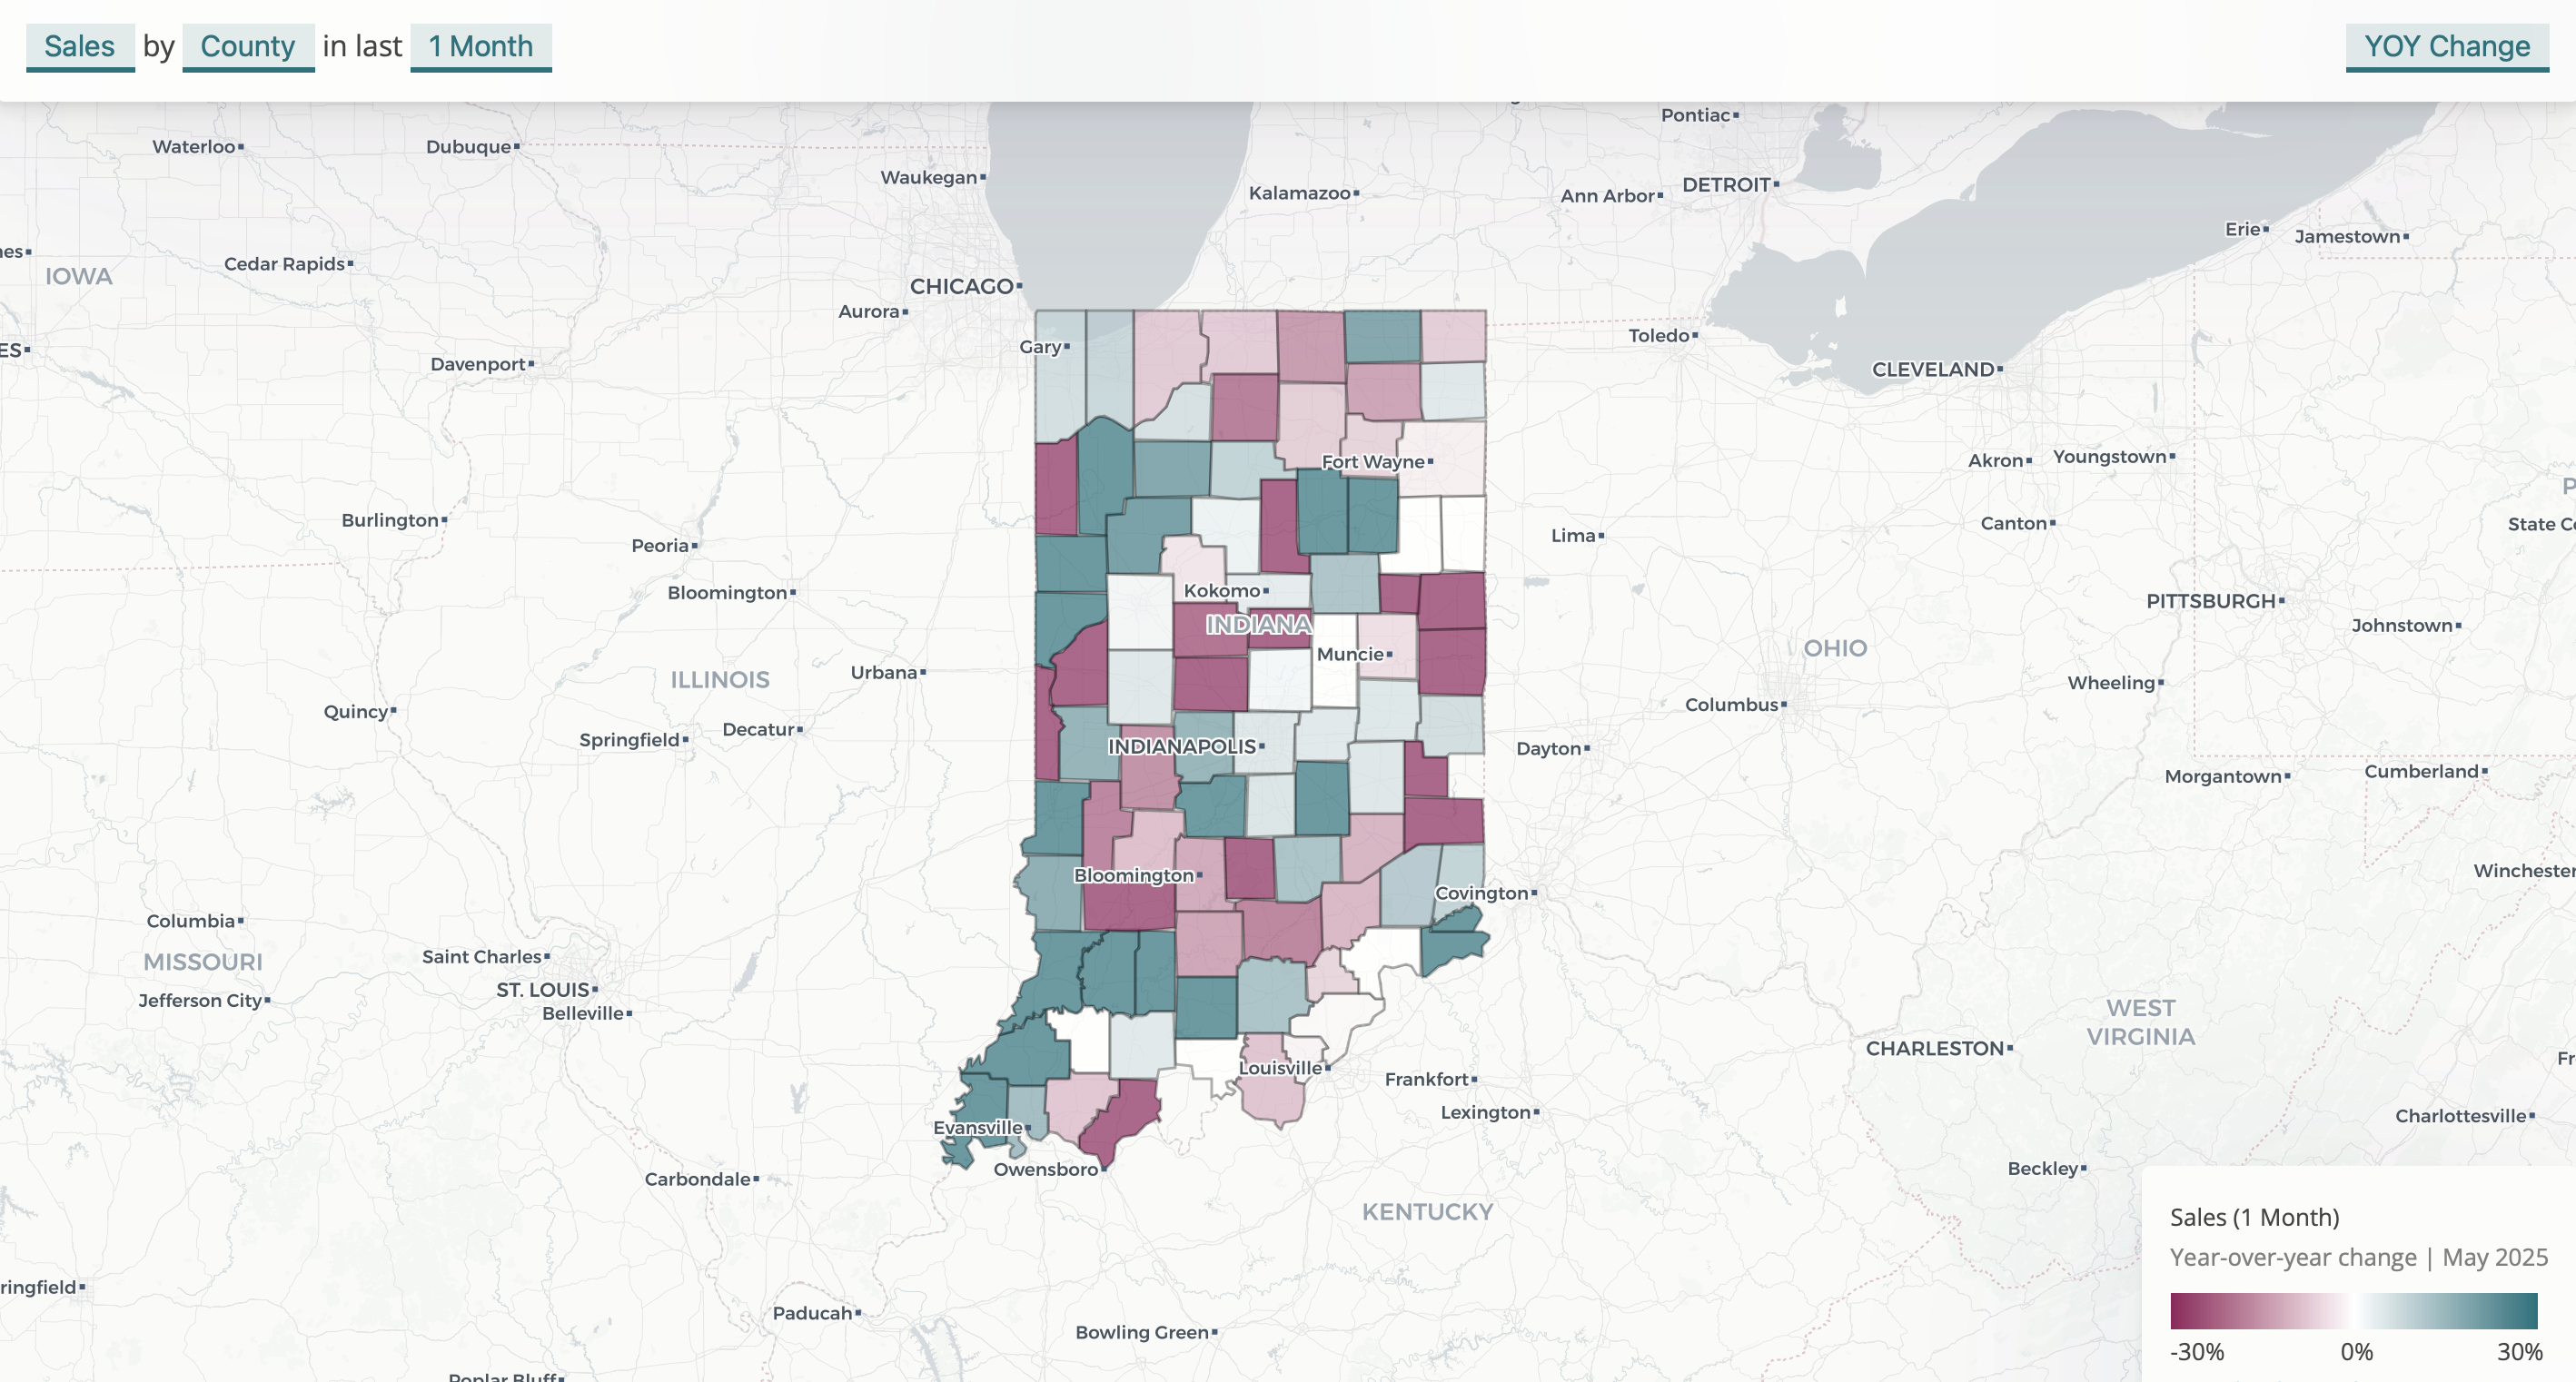
Statewide, sales were up 1% year-over-year in May. Most of this growth was concentrated in urban centers or suburbs—urban core counties were up 6% and suburbs 4%. Meanwhile, sales in rural counties declined 3%. Marion County was up 6%, Lake County was up 9%, and Vanderburgh County was up 18%. Allen County countered this trend, with sales declining by 3%.
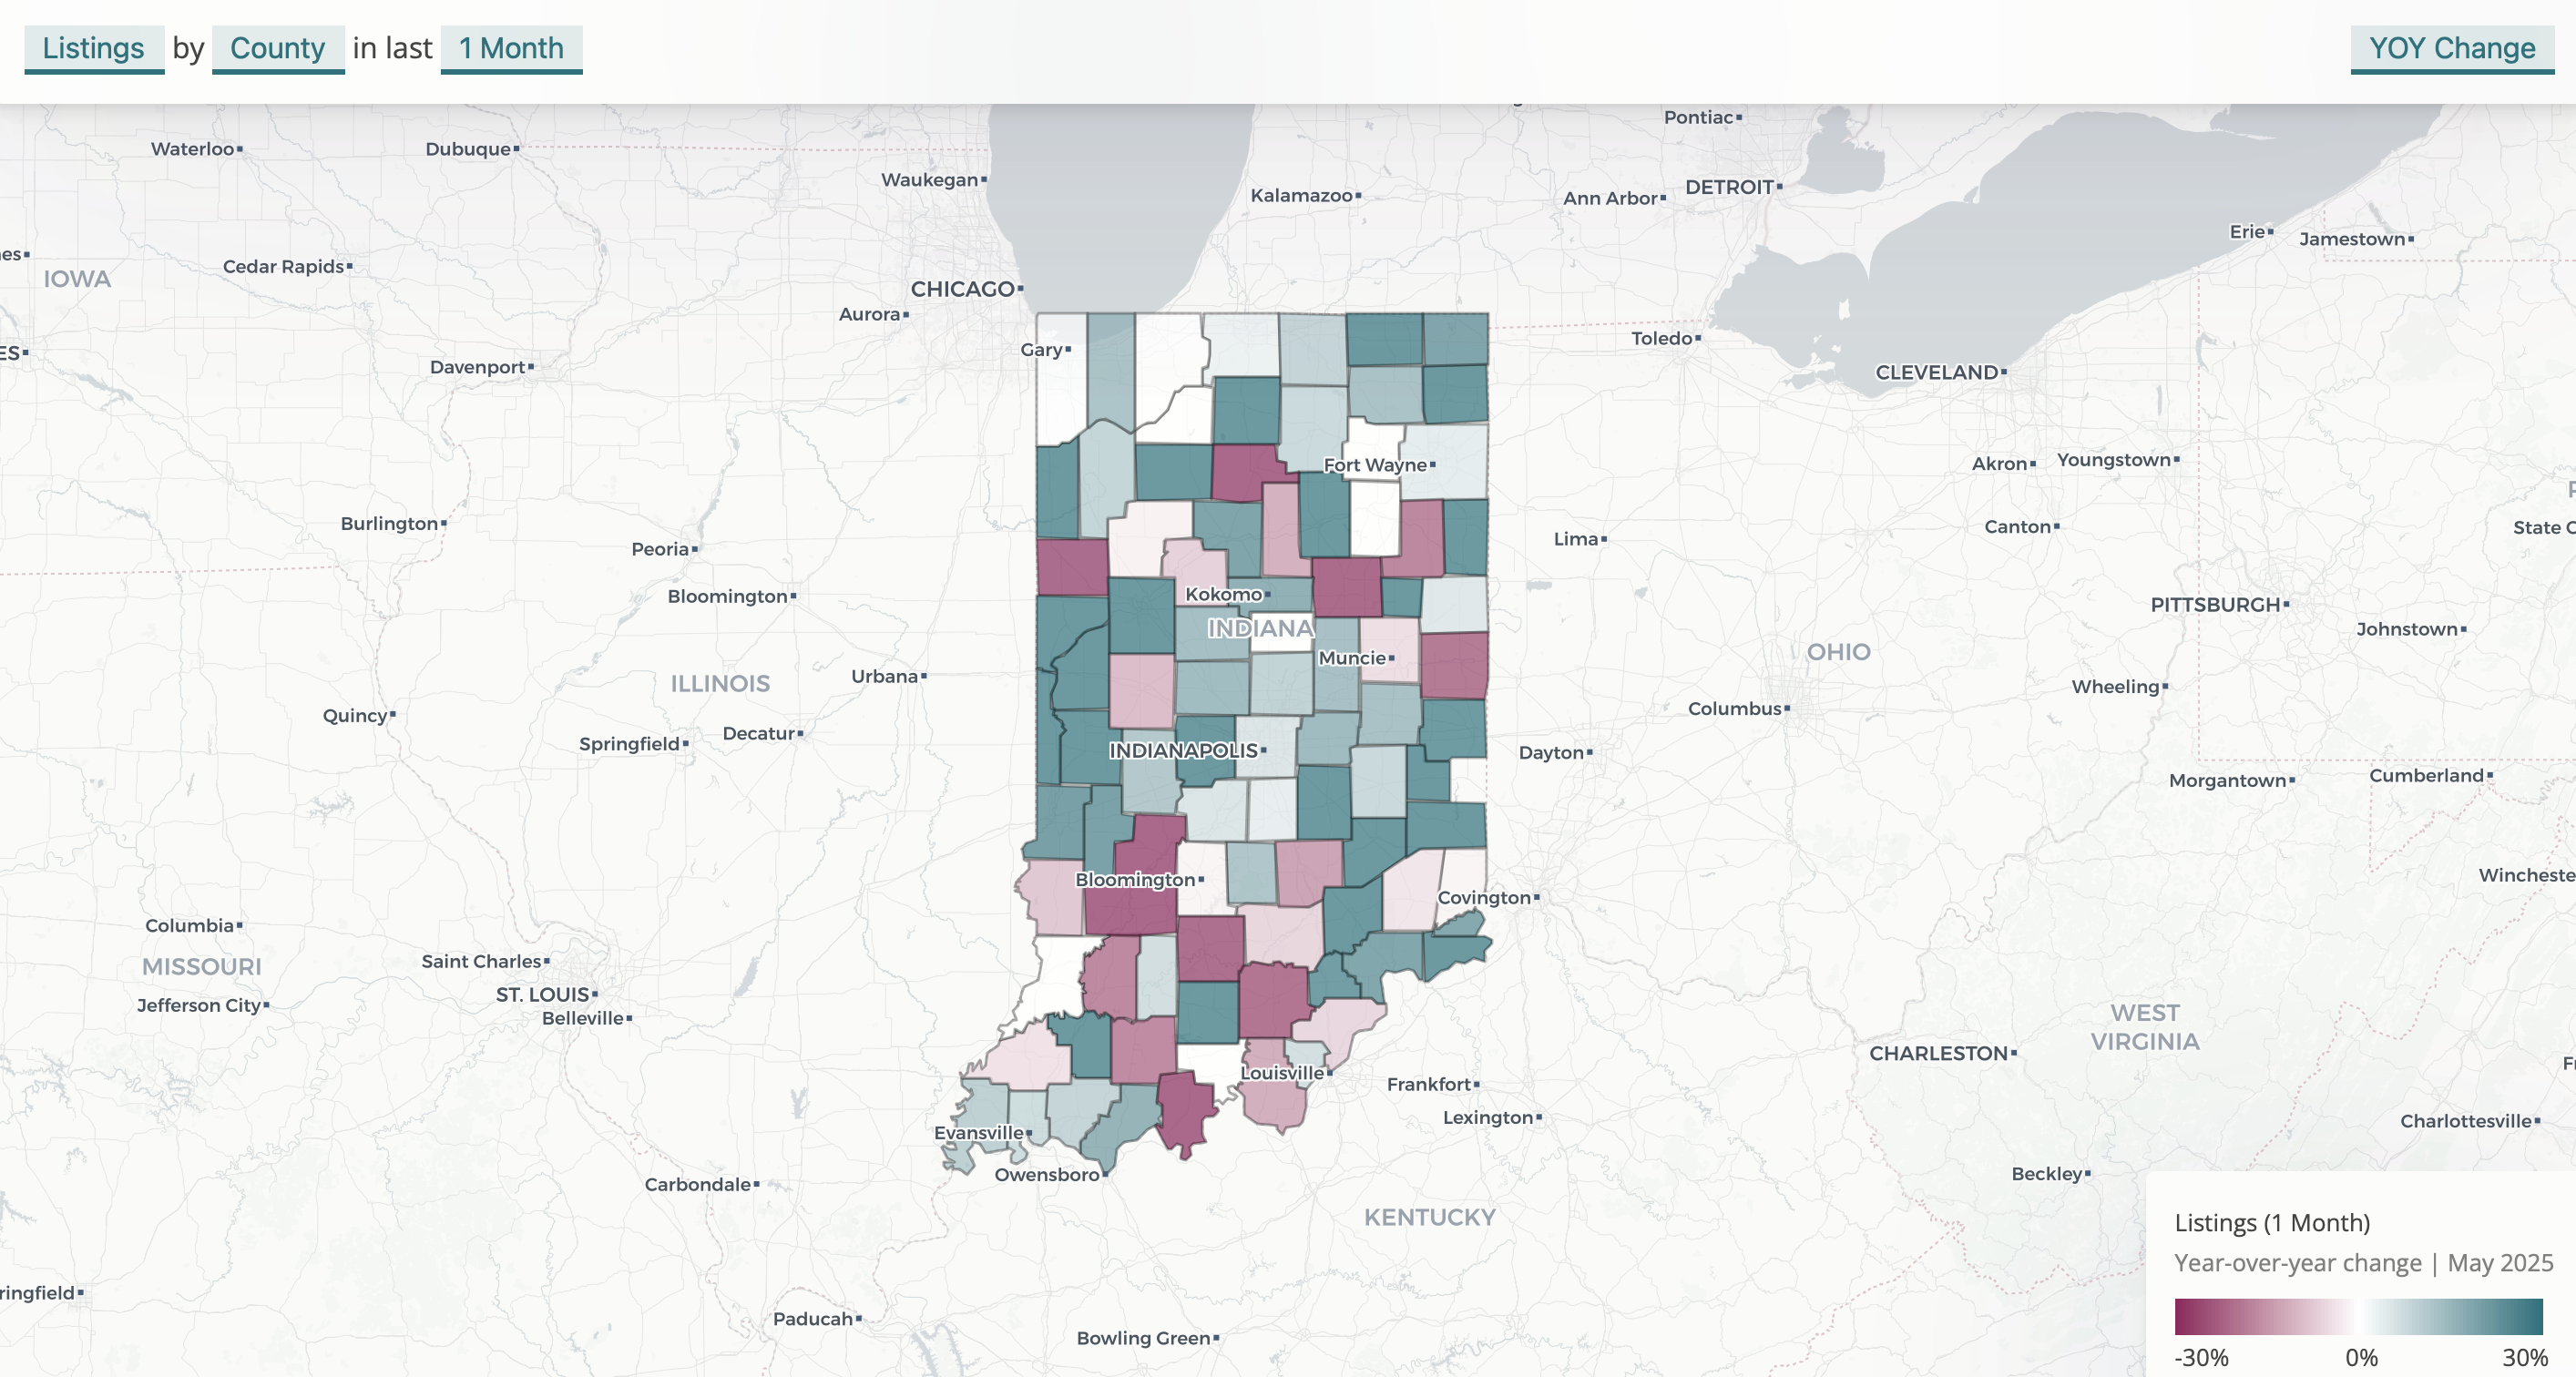
Growth in listings was widespread. Indiana saw 8% year-over-year growth in May, and 58 counties also saw positive growth. Growth was positive across urban, suburban, and rural areas. In fact, the five counties with the fastest listing growth are all smaller communities.
| County Name | Listings | YOY Growth |
|---|---|---|
| Wabash | 50 | 108.3% |
| Lagrange | 41 | 86.4% |
| Newton | 24 | 84.6% |
| Decatur | 37 | 76.2% |
| DeKalb | 72 | 71.4% |
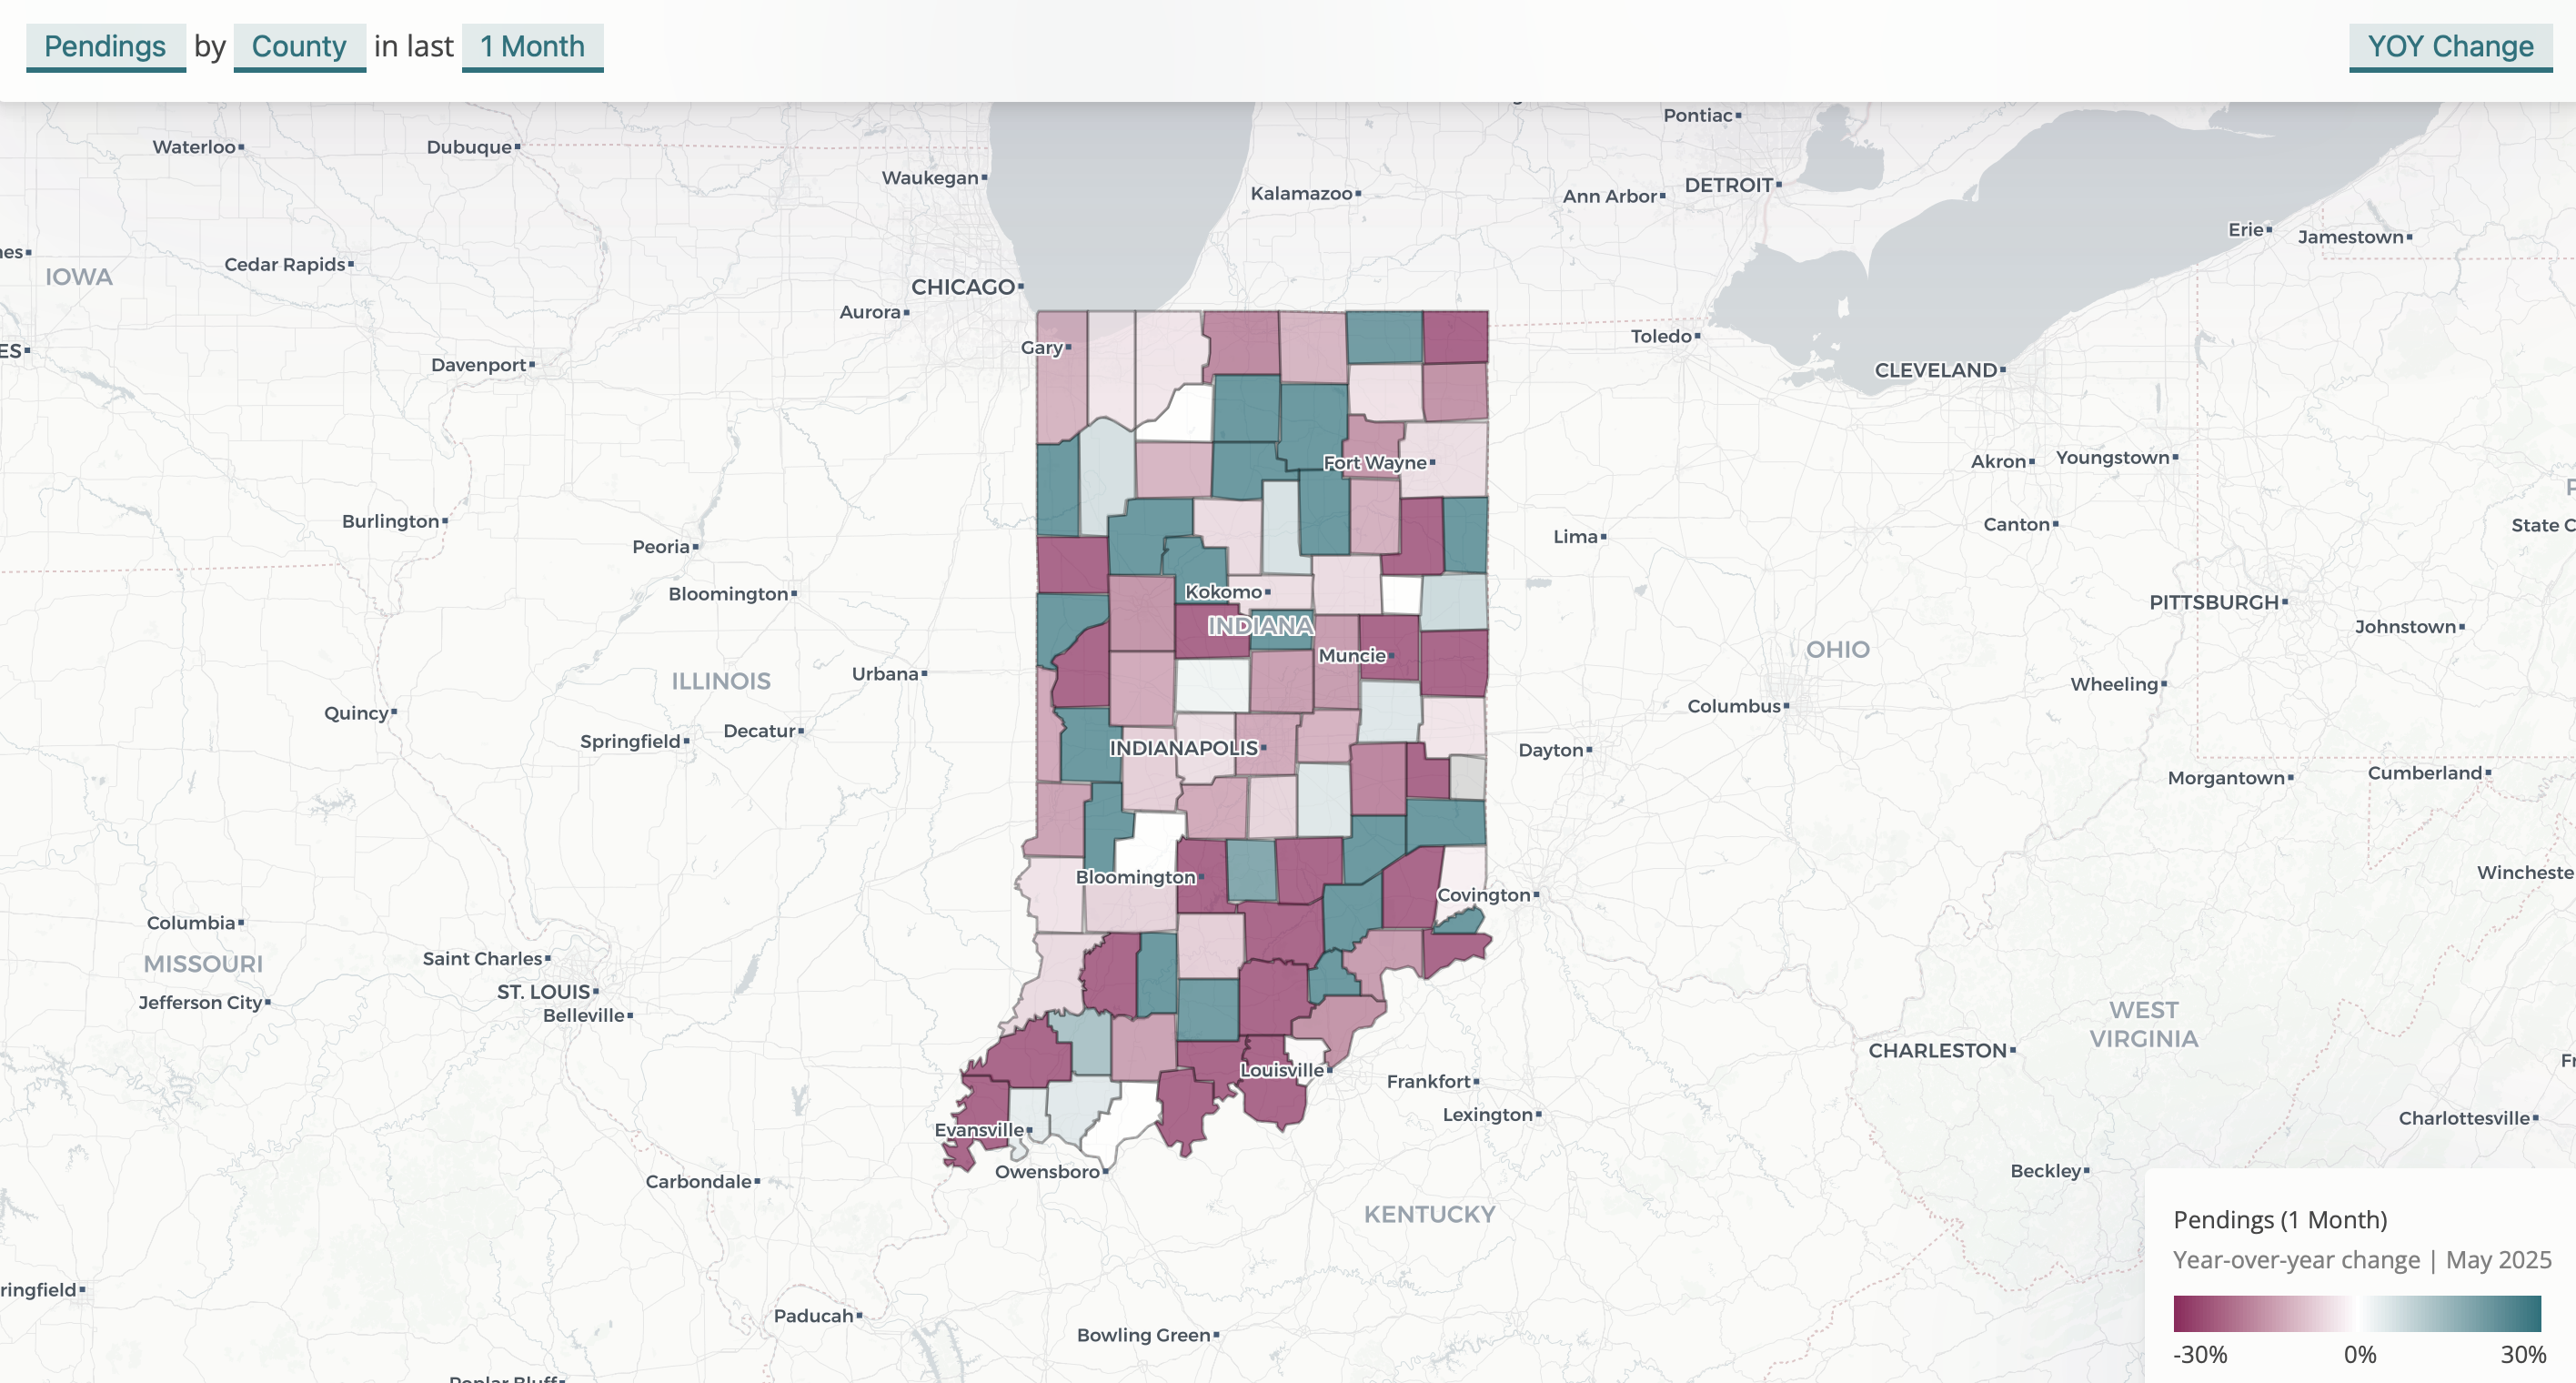
Unfortunately, pending sales showed more weakness, with a 13% decline statewide. Rural counties outperformed the state, with only an 8% decline in pending sales. Overall, 30 counties had growth in new contracts. Some smaller counties (below) had strong contract growth, which bodes well for continued sales growth
| County Name | Pending Sales | YOY Growth |
|---|---|---|
| Marshall | 28 | 133.3% |
| Scott | 40 | 110.5% |
| Jennings | 41 | 70.8% |
| Adams | 26 | 52.9% |
| Decatur | 37 | 37.0% |