
We forecast the state needs to double the rate of construction to meet housing needs by 2029.

The market has slowed, but not for everyone. Correctly priced homes still go under contract in about a week. The slowdown is concentrated in mispriced listings.

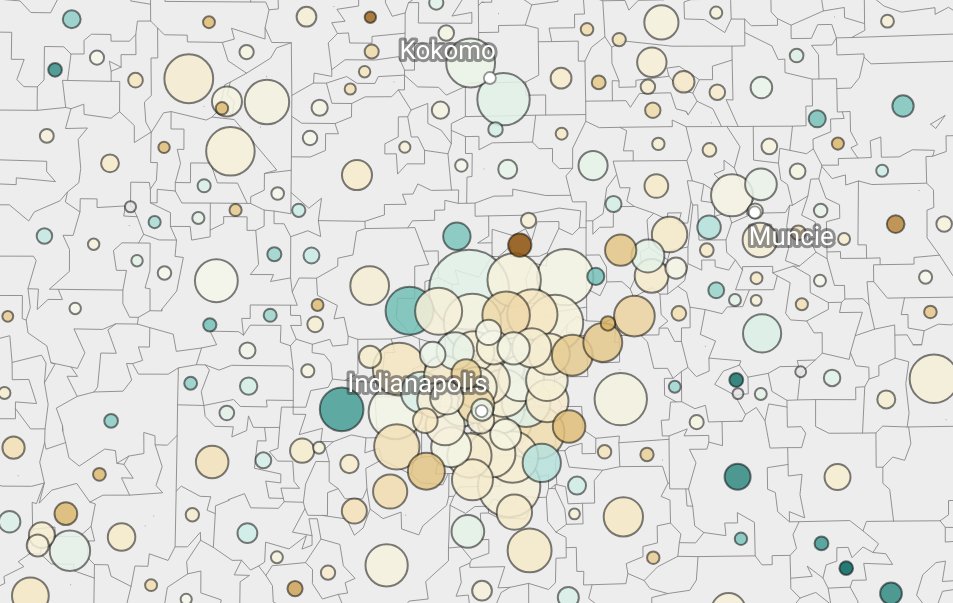
Indiana sellers see 5.4% annual appreciation in Q1 2026
 In a new weekly feature, we look at days on market by county in our latest weekly data.
Statewide median sale price grew by 4% year-over-year in the third quarter, but most metro areas in the state experienced price growth that was significantly faster or slower than the average.
We analyzed 12 months of sales from September 2023 to August 2024 to see if homes were under contract faster when listing prices were closer to the sale price. When the listing price was on target, 75% of homes sold in 14 days. Listings that have to come down in by price by even 5% can stay on the market for weeks.
 While sales in the last 12 months are down 7% year-over-year, one-in-four high-volume ZIP Codes are beating that trend with positive sales growth.
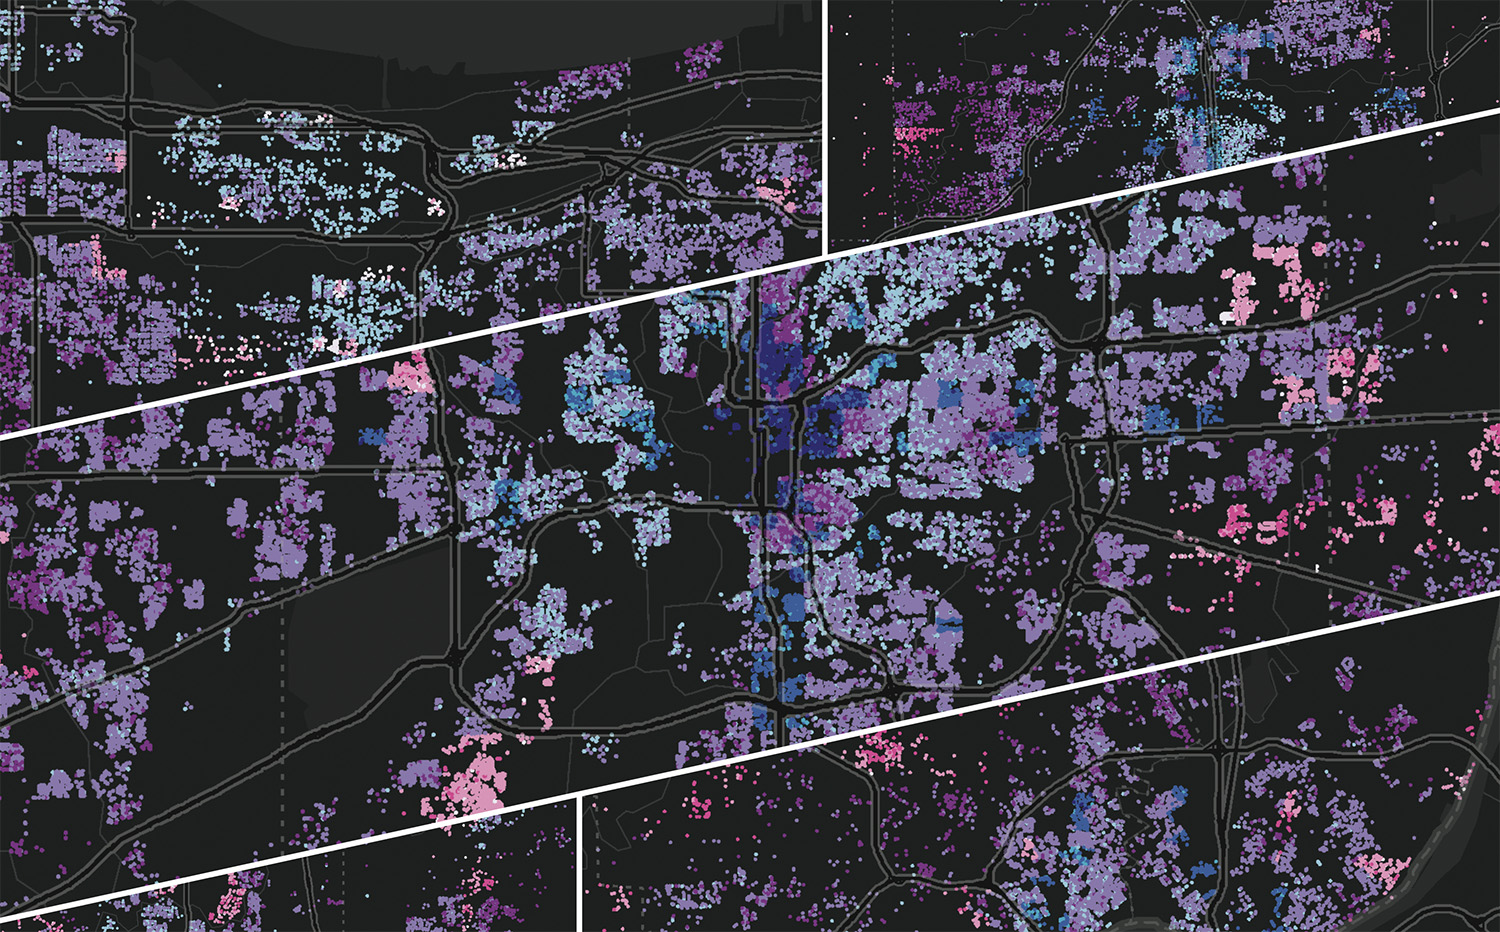
In larger cities across Indiana, older homes in neighborhoods near downtowns have experienced significant increases in sale price and volume over the past five years – leading a trend of rising home values and an overall price premium for walkable neighborhoods in urbanized counties.
Four out of five Hoosier households live in a metropolitan area. We explore market trends using the latest April 2024 data.
Using MLS sales and price data, we’ve created a statewide map showing home price changes through 2023 in half-mile ‘neighborhood-scale’ areas. This is a great way to see how property values are changing if you are considering buyer or buying or selling a home – but for current homeowners, it’s also a way to evaluate the accuracy of 2024 property tax assessments.