 Reports
Markets
Latest
Maps
Learn
Spark
Reports
Markets
Latest
Maps
Learn
Spark
Indiana is growing. From 2010 through 2025, our average annual population change (0.48%) outpaced all of our Great Lakes peers with the exception of Minnesota as we added about a half-million new Hoosiers to our ranks—good news for our economy and our housing market.
But how we’ve grown has changed: From World War II through the Great Recession, roughly 90% of Indiana’s population growth came from natural increase—births outnumbering deaths. Over the past fifteen years, growth has been evenly divided between natural increase and net migration from across the country and around the world.
Do more with this research
Resources to inform and advocate for your industry
Present our findings with a tight slide deck, print this report, share the executive summary, or find your city's zoning code
We measure housing needs in households; migration adds households and creates more immediate housing demand.
With migration momentum and falling birth rates, the size of our households has changed, too.
We’ve added roughly 300,000 net households since 2010, but about 45% of those (146,000) have been within the five year period from 2019 to 2024. This coincides with rising migration and another accelerating trend—more Hoosiers living alone or in two-person households, as our average household size dropped from 2.52 to 2.46 from 2019 to 2024 (after hovering at or above 2.5 through the 2010s).
These growth patterns matter to our real estate market and policy agenda.
Most of Indiana’s new households are homeowners, as our homeownership rate has consistently exceeded 70% over the past decade. But understanding the demographic factors driving household formation also helps us understand where the real estate market is heading and how housing policy needs to meet the needs of current and future homeowners:
Indiana’s housing shortage isn’t simply a matter of statewide arithmetic; in our previous analysis (‘Facing Up to Indiana’s Housing Shortage’), we sought to localize the issue by looking at previous and projected housing needs and building trends. This study takes the next step with a household-level look at demographics, housing demand and potential strategies to improve access and affordability in Indiana’s diverse communities.
Section One: population
In a decade, Indiana's growth changed from births to migration from abroad (56%) and other states (27%).
International migration was still the top driver of growth, adding over 17,000 Hoosiers. But domestic migration increased from 4,300 in 2024 to 12,200 in 2025, the strongest year since the pandemic. Births and deaths were steady, so our population naturally increased by 8,600.
Population change, 2024-2025
Shrinking by more than 0.25%: 14 counties
Stable change < 0.25% either direction: 35 counties
Growing by more than 0.25%: 43 counties
We categorized counties with similar growth patterns based on their natural population change, domestic migration, and international migration. We used a statistical method called clustering to discover five groups of counties that share similar characteristics.
The fastest growing counties are Boomtowns, fueled by growth from domestic migration, but with positive contributions from births and international arrivals as well. Seven Indiana counties fell into this group, including Hamilton, Hendricks, Johnson, Hancock, and Boone. On average, these counties added about 19 new residents for every 1,000 people already living there. Together, these seven counties accounted for 53% of Indiana's population growth in the past year, despite representing less than 8% of the state's counties.
A second group of 24 counties tells a more surprising story. In the Migration-driven group, which includes Madison, Delaware, Vigo, Grant, Howard, and Morgan, deaths outpaced births over the last five years. What keeps these counties growing is domestic migration from other US states, which more than offsets the natural decline. Without newcomers, they would be shrinking. This is the same set of post-industrial cities where household size is falling fastest. Together, these 24 counties added another 14% of the state's growth.
Three smaller groups round out the picture. Six International gateway counties — Marion, Tippecanoe, Monroe, Bartholomew, Jackson, and White — grow primarily because of arrivals from other countries. In Marion County alone, international migration is large enough to offset the loss of nearly 11,000 residents to other US states. These six counties contributed about 10% of state growth in the past year. Twelve Natural-driven counties, concentrated in northeast Indiana and including Allen, Elkhart, and LaGrange, are still growing the old-fashioned way, with births outpacing deaths, adding another 10%. And a final Stable group of 43 counties, nearly half the state, saw movements too small in all three components to add up to meaningful change, together contributing about 13% mostly through small gains distributed across many places.
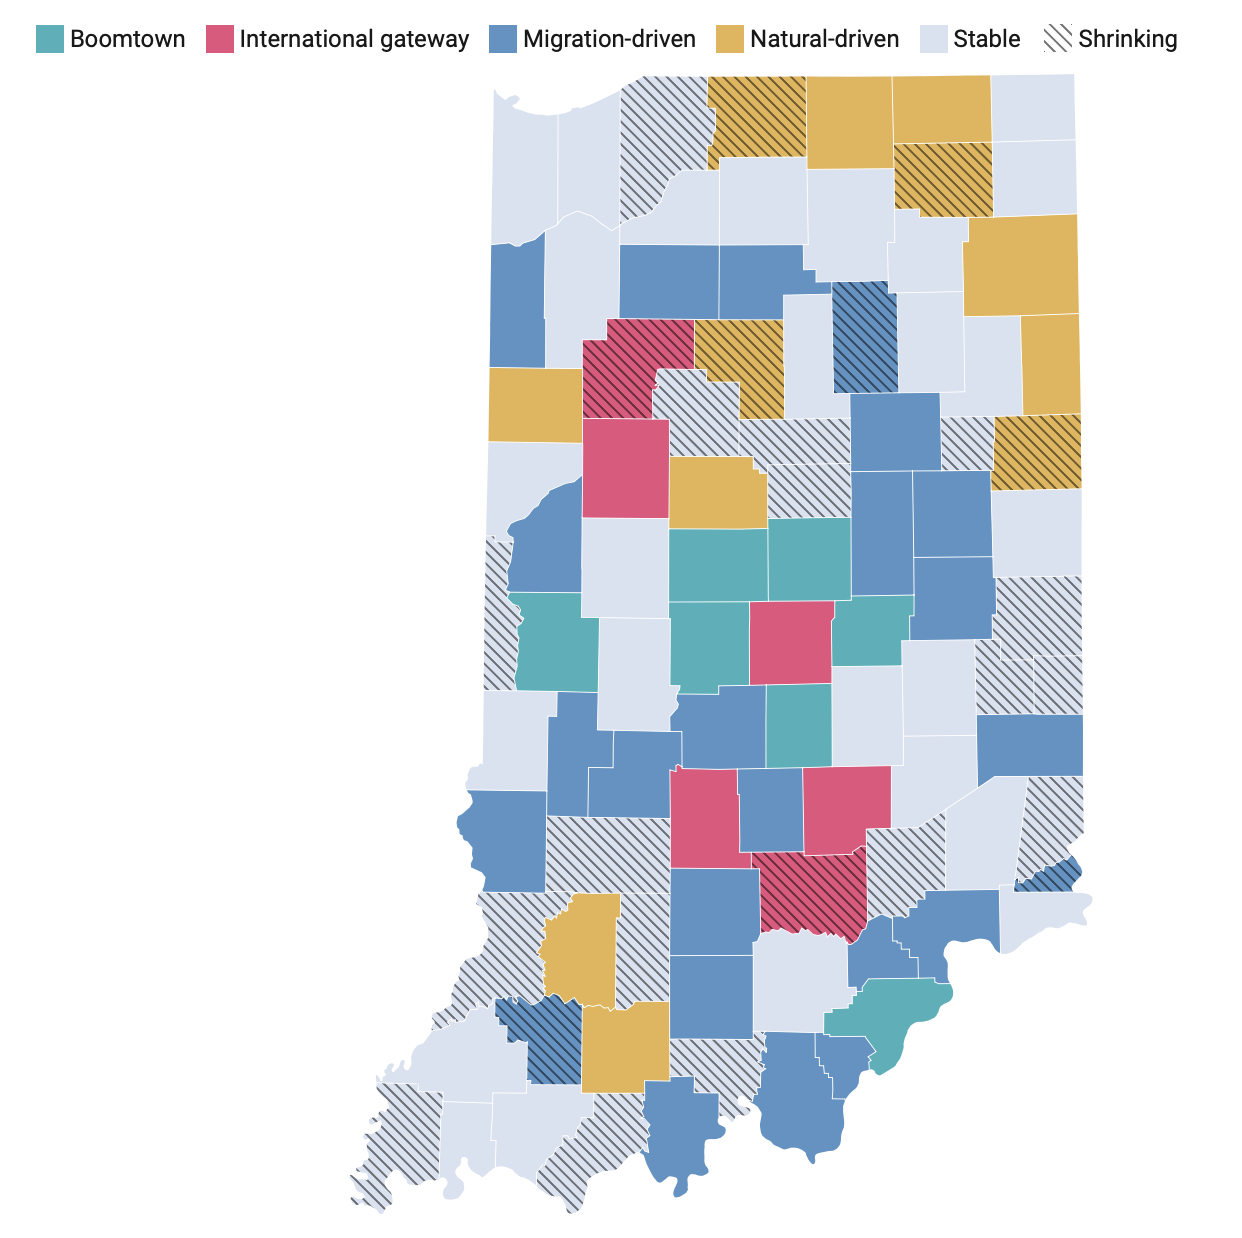
Boomtowns · 7 counties · Avg. domestic migration: +15.7 per 1K:
Movers from other counties are the dominant engine. Fastest growing counties.
International gateway · 6 counties · Avg. int'l migration: +6.6 per 1K: Immigrants fuel growth despite often losing population to other counties.
Migration-driven · 24 counties · Avg. domestic migration: +8.0 per 1K:
Would be shrinking if not for domestic migration.
Natural-driven · 12 counties · Avg. natural increase: +3.9 per 1K:
Slow-growing counties where births outnumber deaths.
Stable · 43 counties · Avg. total pop. growth: +0.3 per 1K:
Stable counties where migration offsets natural population decline.
INternational Migration
Six gateway counties, six different storiesInternational migration is the largest growth driver in Indiana, led by these six counties. Each one pulls from a different place.
DOMESTIC MIGRATION
In 2024, we gained nearly 12,000 residents from Illinois and another nearly 10,000 from Georgia, Kentucky, California, and New Jersey. We mostly lost population to the Sun Belt (and Tennessee), but we also lost population to the neighboring state of Michigan.
Section TwO: Households
Between 2019 and 2024, there were nearly 8 new households for every 10 new people.
households
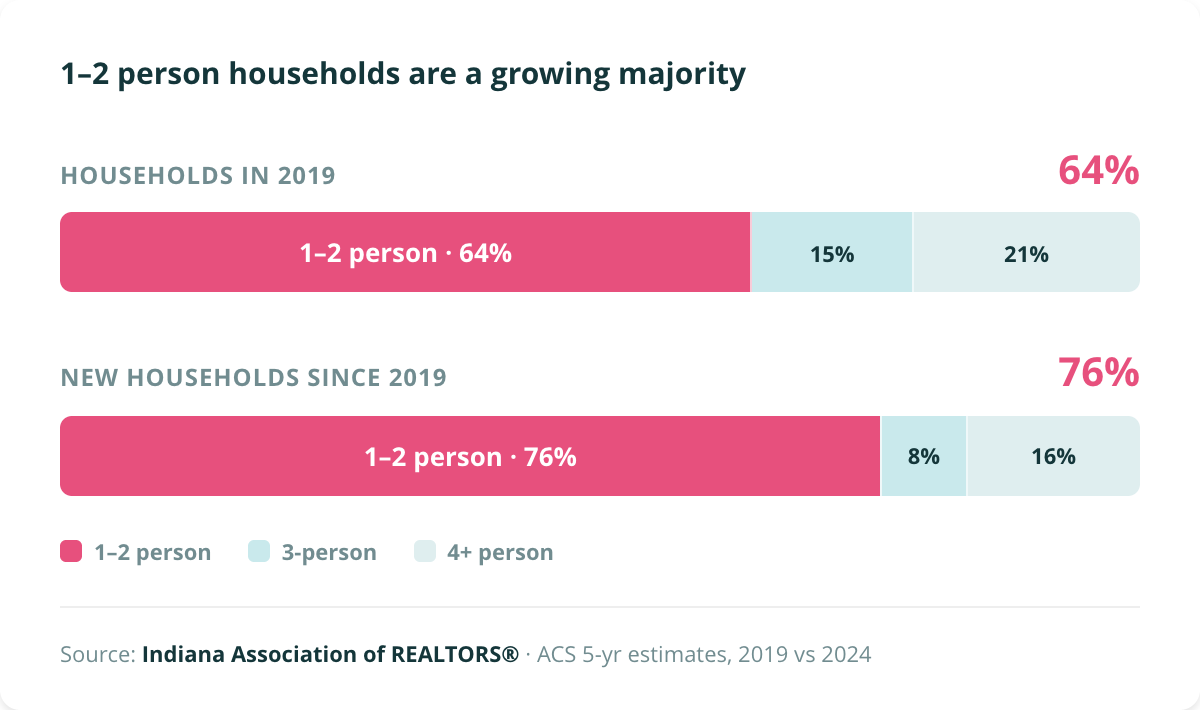
In the last five years, Indiana has added over 140,000 households, and 110,000 have been individuals or two-person households. 40% of new households contain one person and 36% contain two people.
growth in small households
Each dot is one Indiana county. Position shows how the county's small and large household counts changed from 2019 to 2024.
| Growth pattern | Counties |
|---|---|
|
Gaining small, losing large
|
32 |
|
Gaining both, small faster
|
36 |
|
Losing small, gaining large
|
12 |
|
Gaining both, large faster
|
7 |
|
Declining or stable
|
5 |
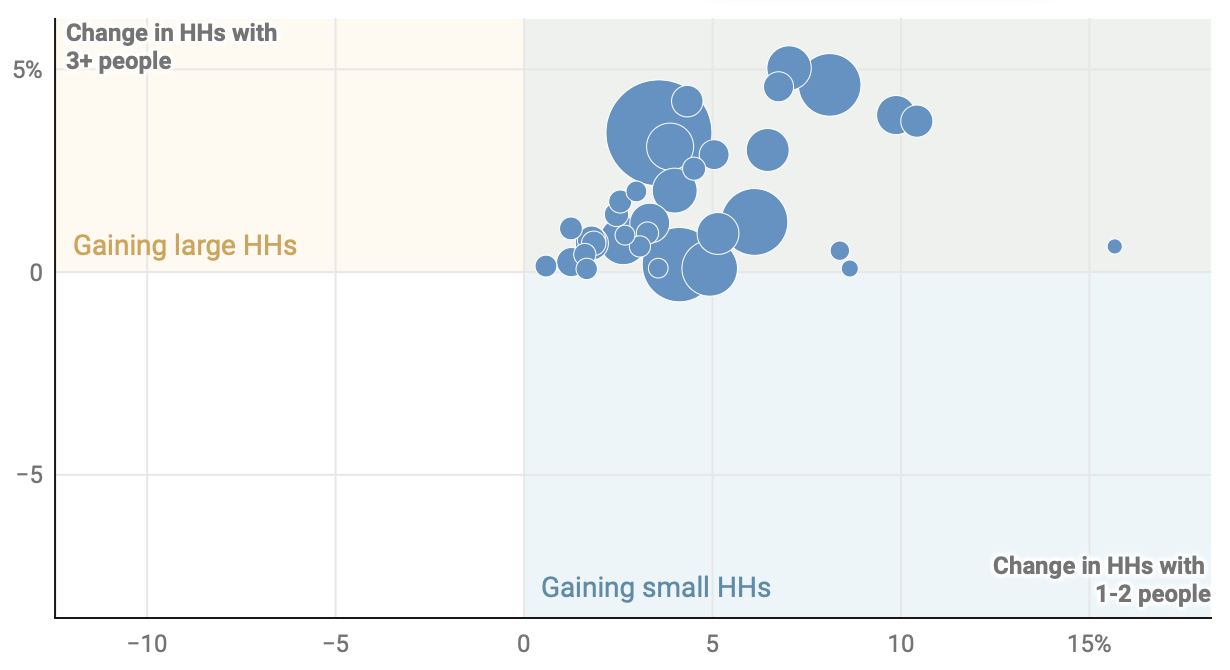
This includes many suburban counties. Hamilton County added 11,000 small households and 6,000 large households. Clark County added 5,000 small and 2,000 large households. This group also includes the largest urban counties. Marion County added 28,000 households roughly equally split between large and small households. But in Lake and St. Joseph counties, over 95% of growth was from small households.
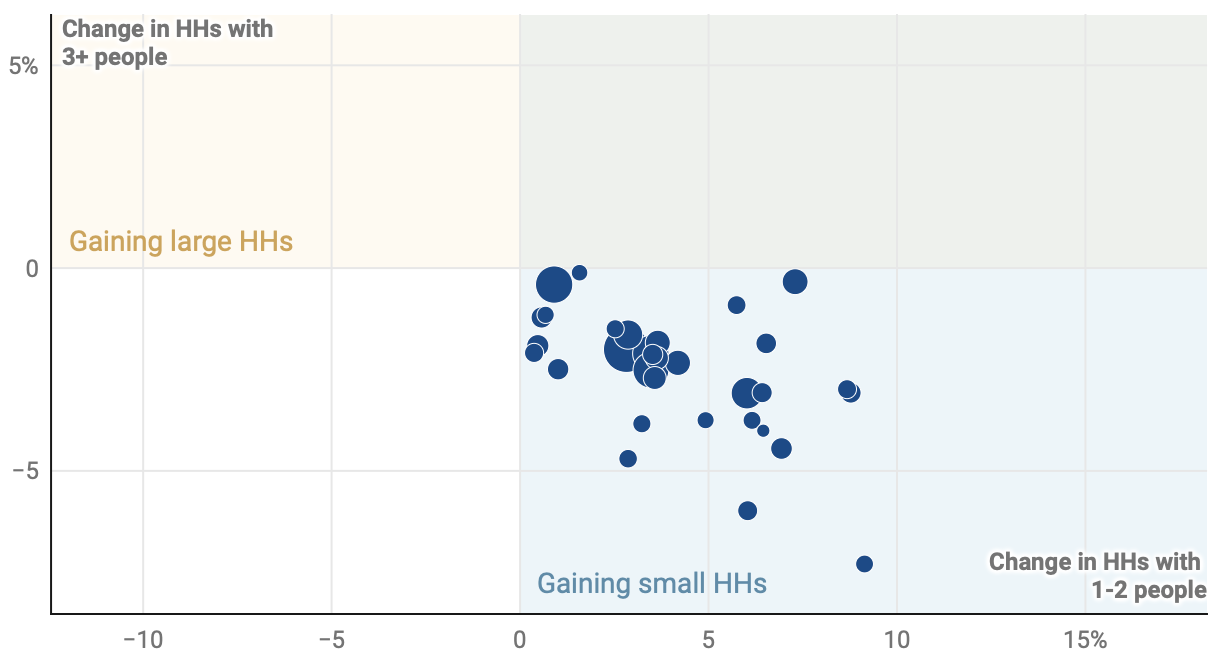
These counties tend to gain households much faster than population. For example, Dearborn County's population grew by 1.6%, but households increased by 7%. All household growth was from small households.
12 of these counties have declining or stagnant population over the past five years (less than +0.5%), but all but one still gained households.
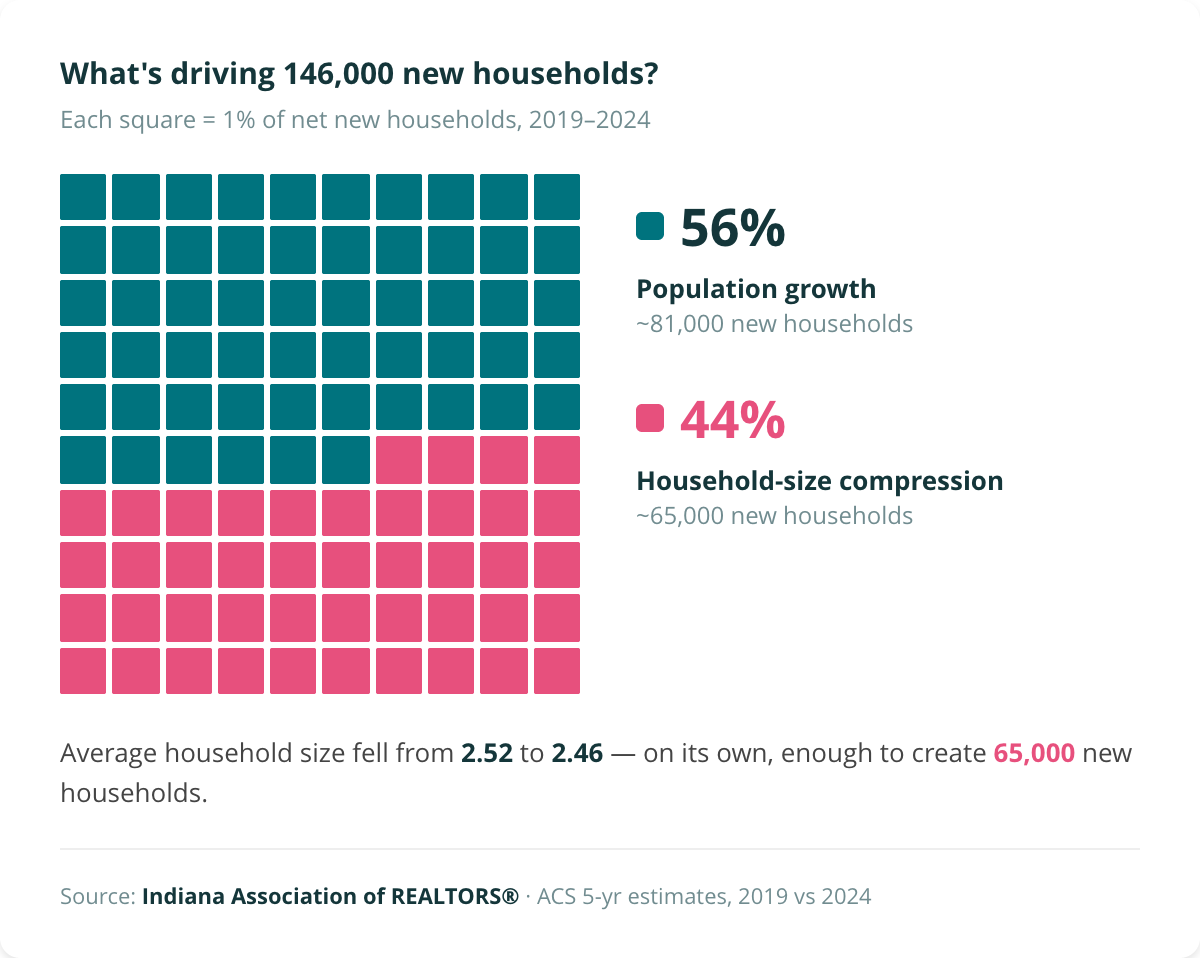
If average household size had remained the same as 2019, we would only add 81,000 new households. Instead, it fell from 2.52 to 2.46, which generated 65,000 more households.
NEW HOUSEHOLDS
We are comparing two snapshots: 2019 and 2024. We see counts of households increasing, but we don't know which are the 'new' households.
The number of people living alone increased by 70,000.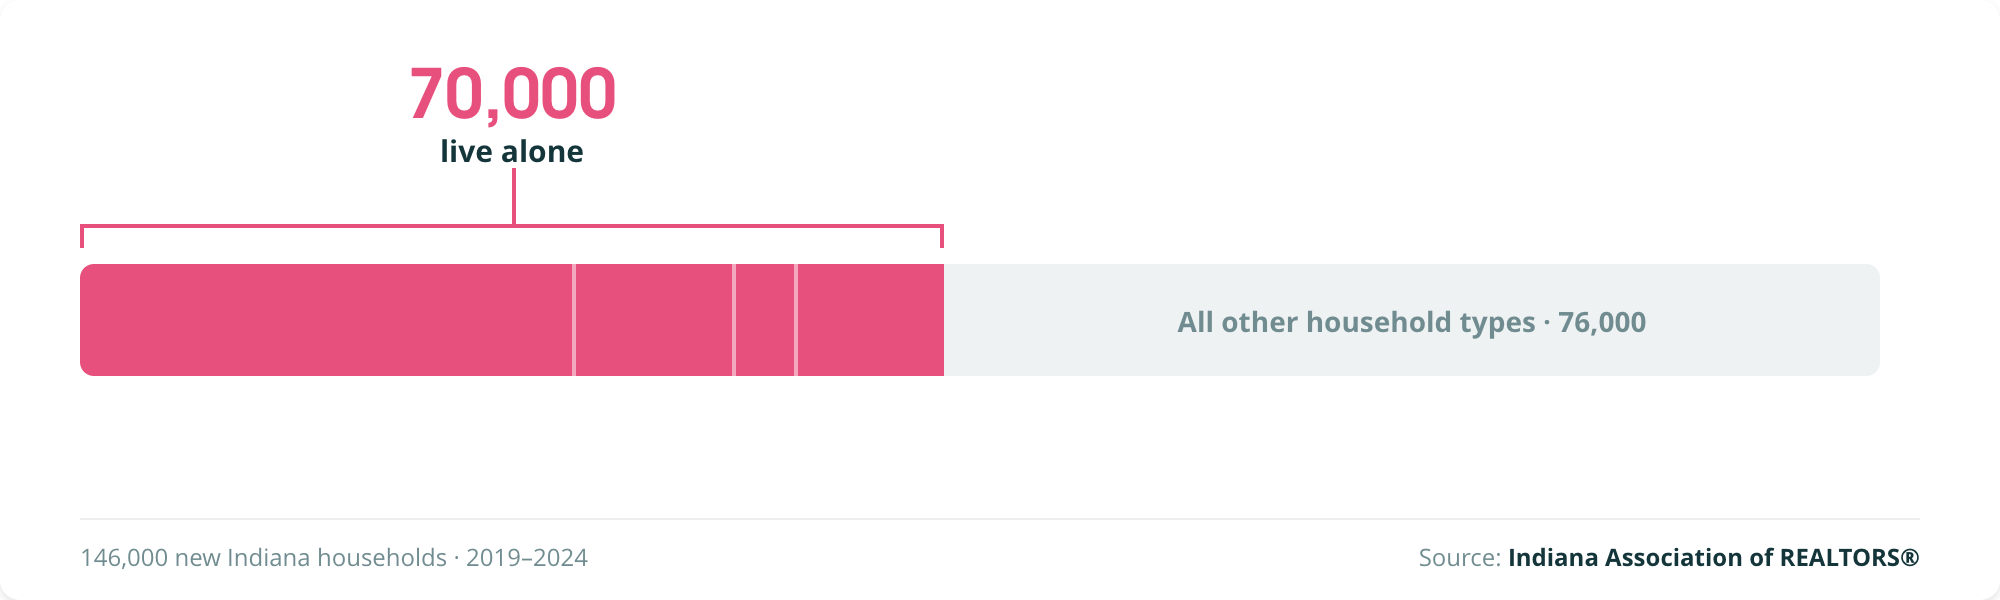
One fourth of this increase is attributable to older adults living alone. They increased by 40,000.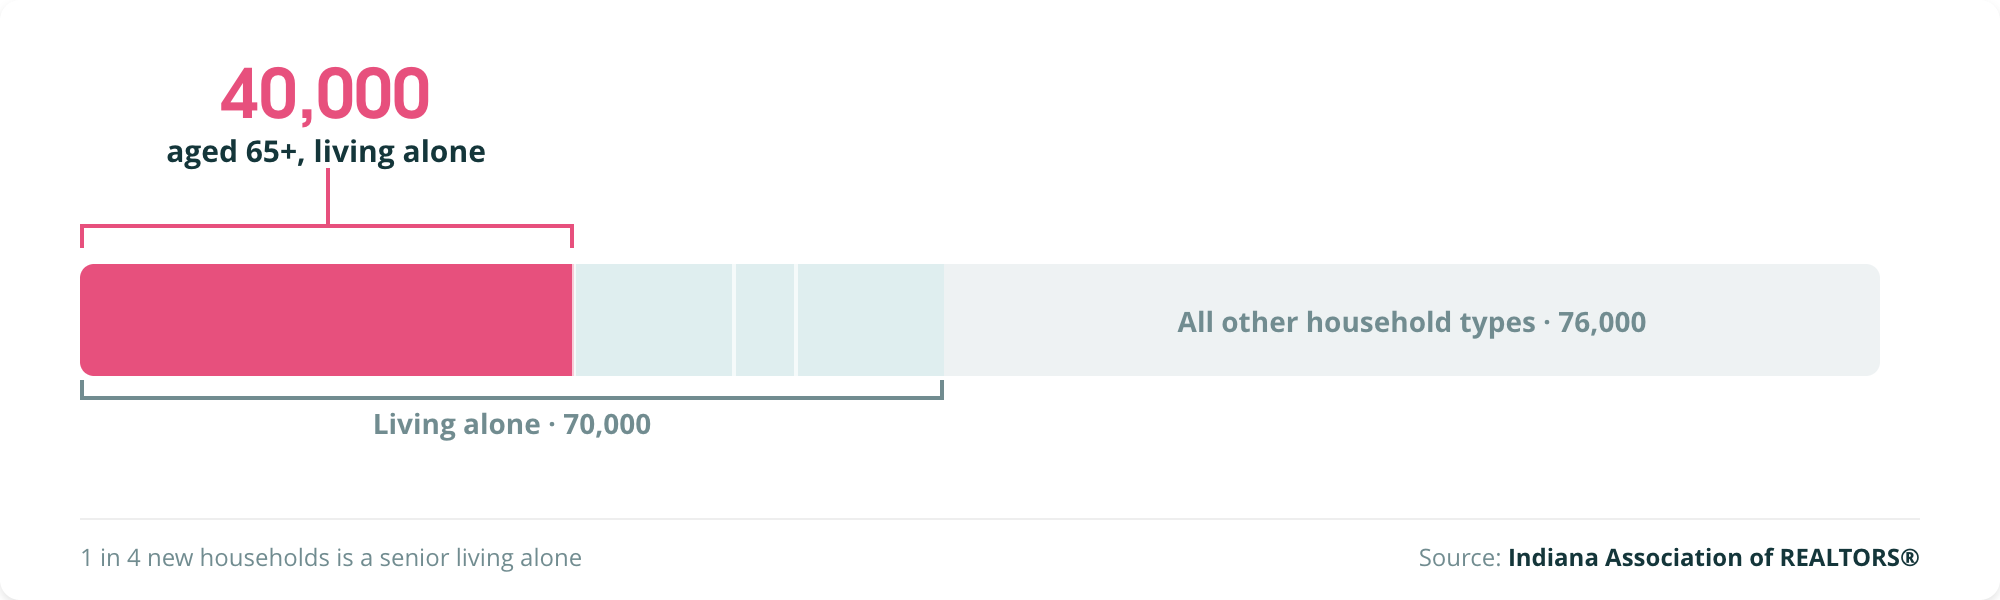
The number of single men increased by 13,000, 1/10th of total household increase.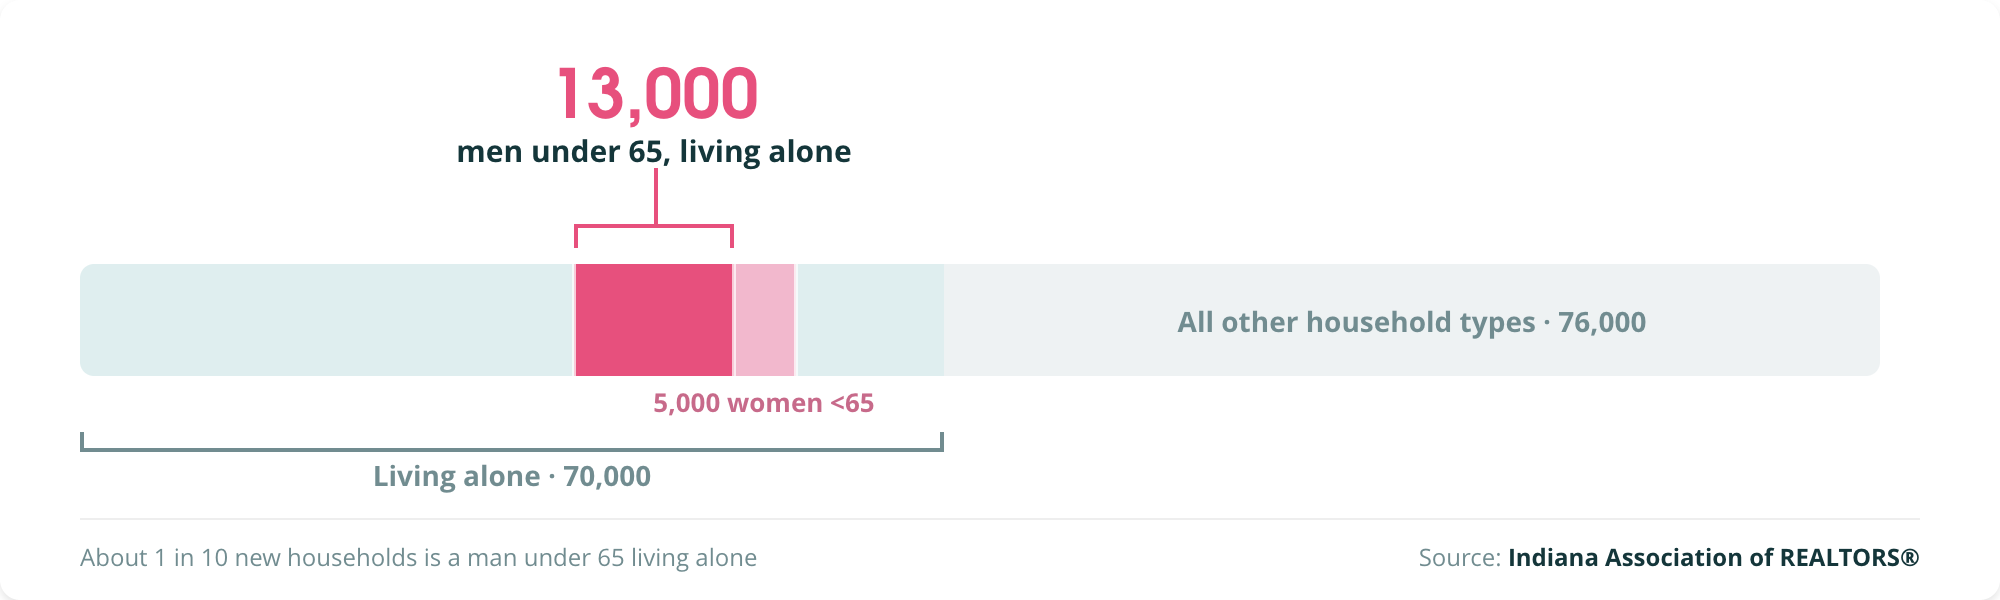
NEW HOUSEHOLDS
There were 80,000 new small households that own their home, compared to 30,000 that rent. Large households are still buying: There were 60,000 new 3+ person households that own their home. But with 25,000 fewer large households renting, the total number of large households only increased by 35,000.
This chart is about all one- and two-person households, not just those who formed in the past five years. But we can learn two things. First, transactions are most common among young adults and older adults. Second, transactions for ages 25-34 grew the most from 2019-2024. The homeownership rate jumped by 4 points for this group (39.3% to 43.3%).
NEW HOUSEHOLDS
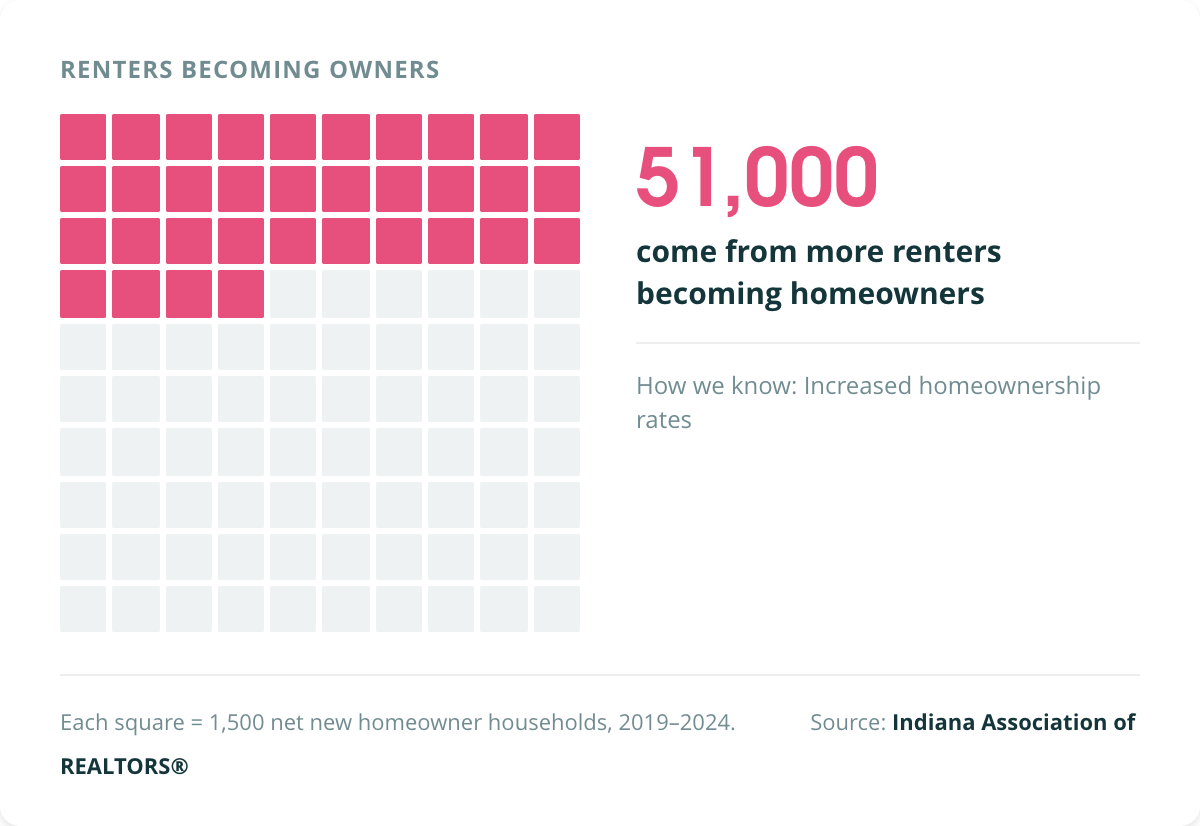
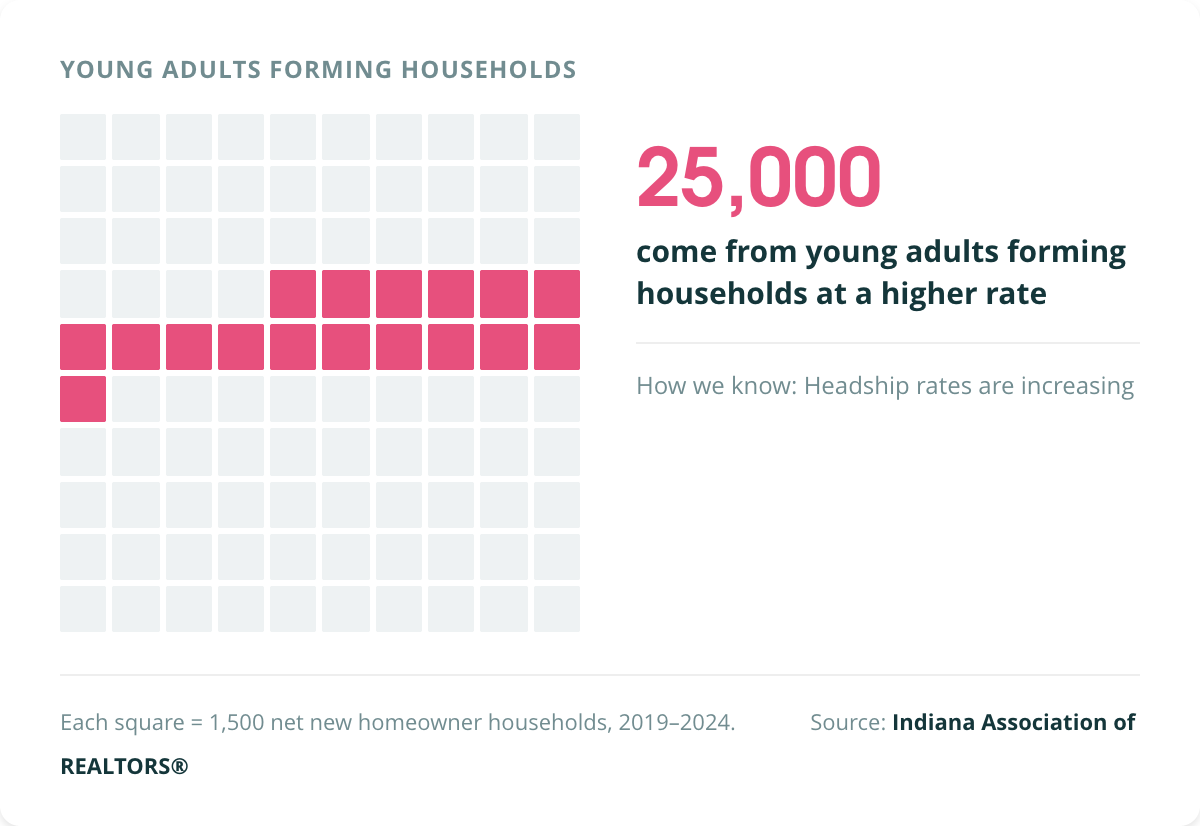
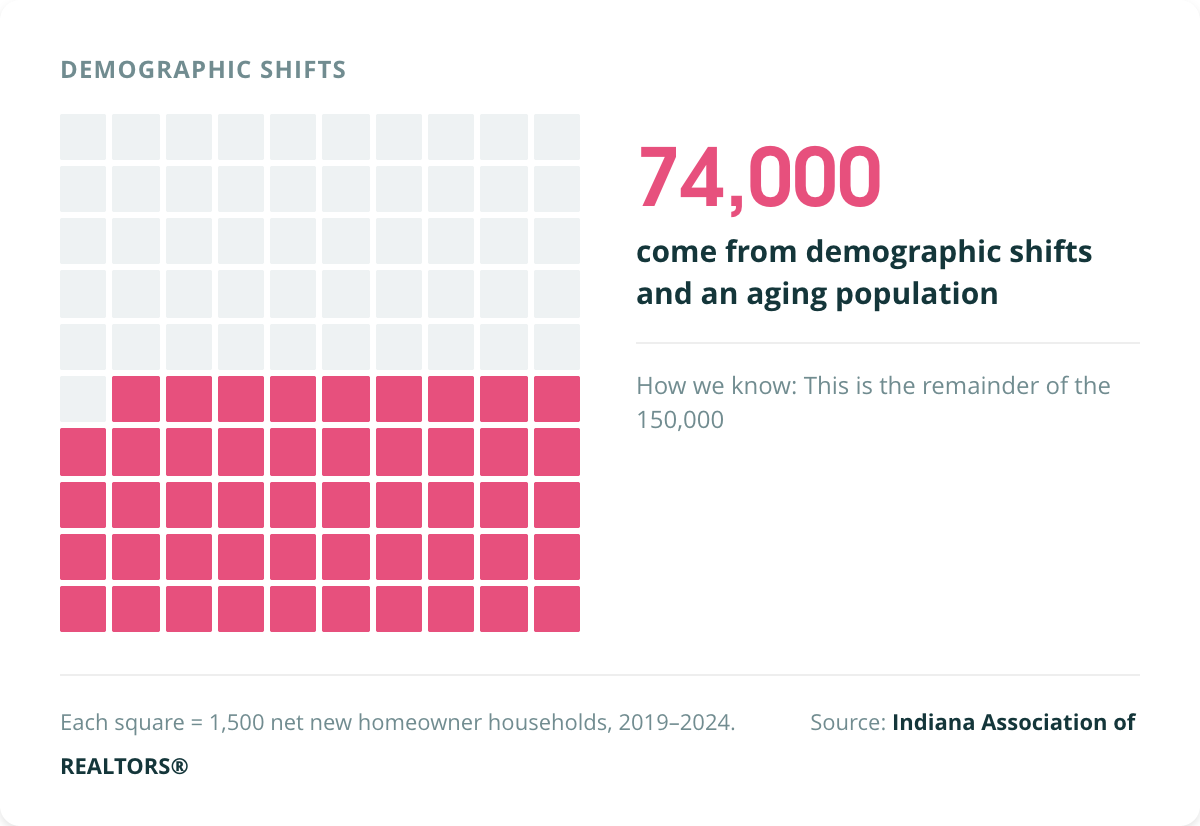
Between 2019 and 2024, Indiana added roughly 150,000 owner households (of all sizes). Under that headline number, three different mechanisms were at work.
How we know this: Homeownership rate rose
Indiana's overall homeownership rate climbed from 69% to 71% in five years. Most of the shift landed in the parenting years: homeownership among 25-to-44-year-old household heads went from 57% to 61%. At age 30-34 alone, the rate jumped from 54% to 59%. That works out to about 51,000 more owner households than we'd have seen if ownership rates hadn't changed at all.
How we know this: Headship rate rose
When young adults move out of someone else's household (a parent's or roommate's) and buy a home between our 2019 and our 2024 snapshots, they form a new owner household.
The share of 25-to-34-year-olds heading their own household went from 46.0% to 48.0% between the two windows. Multiplied through the ownership rate at each age, that formation wave adds about 25,000 owner households to Indiana's count, which is about one sixth of the total change in homeowners.
How we know this: This is the remainder of the 150,000
The rest is the net result of people moving into the state, new households skewing older, and the loss of owners to out-migration, sale, or death.
About 60,000 households a year moved to Indiana from other states and countries. About one third arrived already owning a home.
Indiana's net new households were disproportionately older, and older adults tend to own homes at a high rate — about 82% at ages 65-74.
Section THREE: Existing Homes
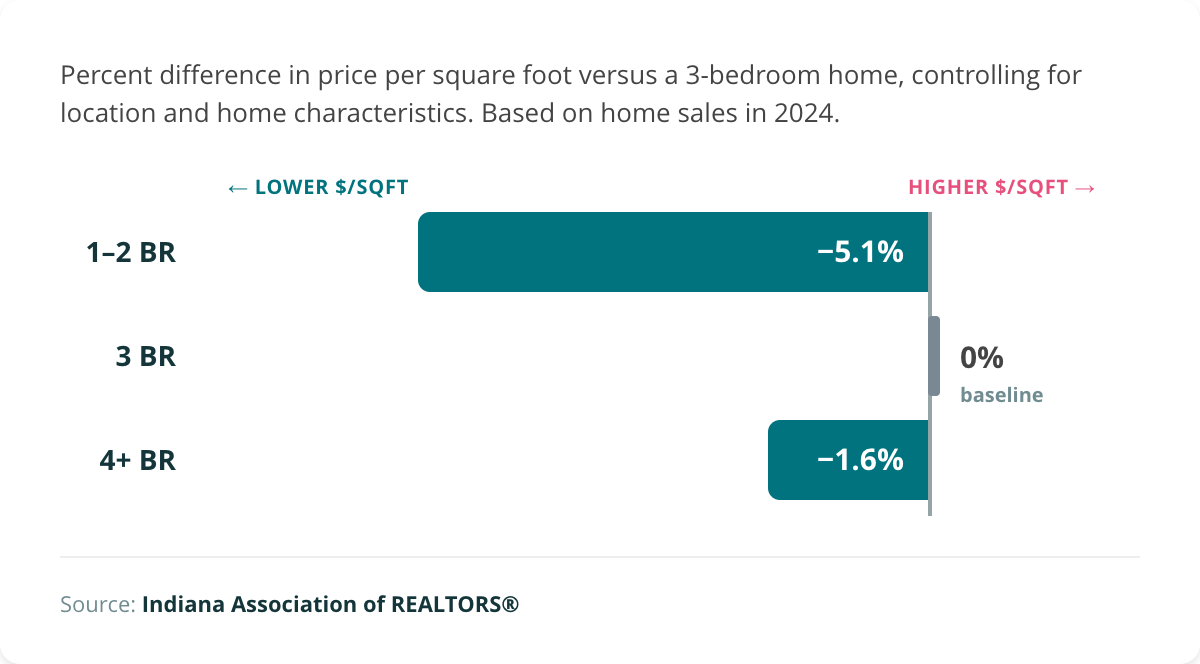
Price premiums for large homes are falling while the discount for small homes lessens.
In 2019, a 4-bedroom home in Indiana sold for a 2% premium compared to a 3-bedroom home. A 1 or 2-bedroom home sold at meaningful 7% discount. Buyers paid more per square foot for more square feet.
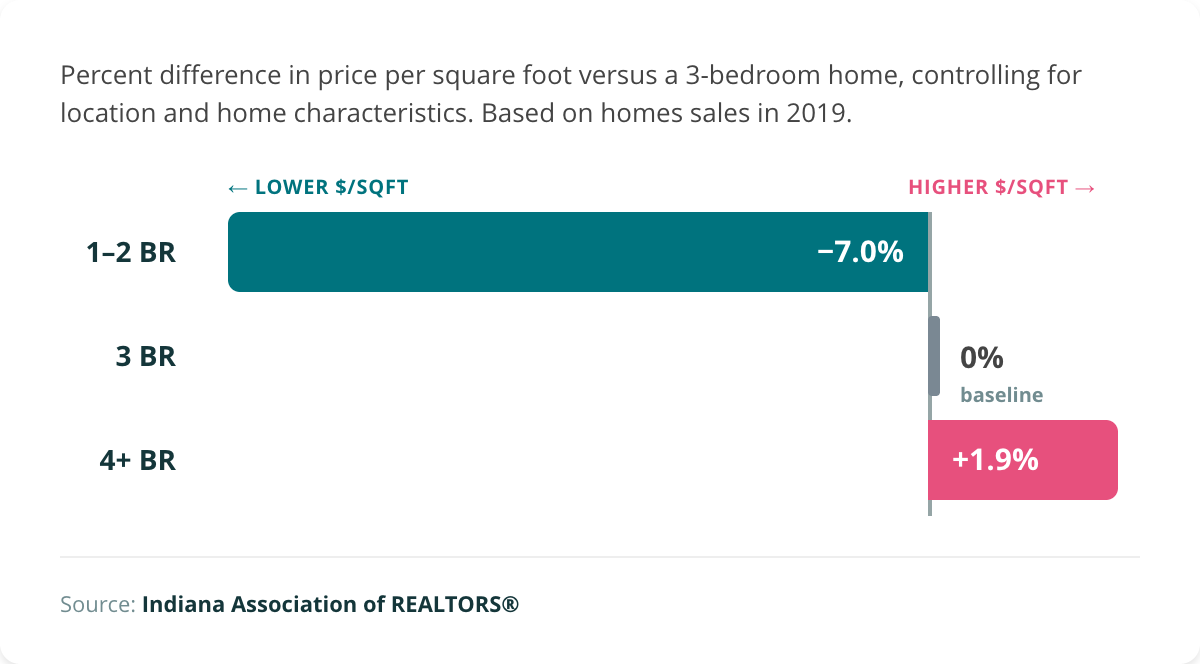
In 2019, buyers paid a 1.9% price-per-square-foot premium for a 4+ bedroom home over a 3-bedroom one. By 2024, that premium had collapsed to −1.6%, meaning 4+ BR homes now sell for slightly less per foot than 3-bedroom homes.
After controlling for a county's starting price levels and initial 4+ bedroom premium, there is a modest but real relationship between small- vs. large-household growth rates and a falling 4+ bed premium. Counties where small households grew about 10 percentage points faster than large households (Wayne, Elkhart, Vigo) saw the 4+ bedroom premium fall about 0.8 percentage points more than counties where the two grew at similar rates.
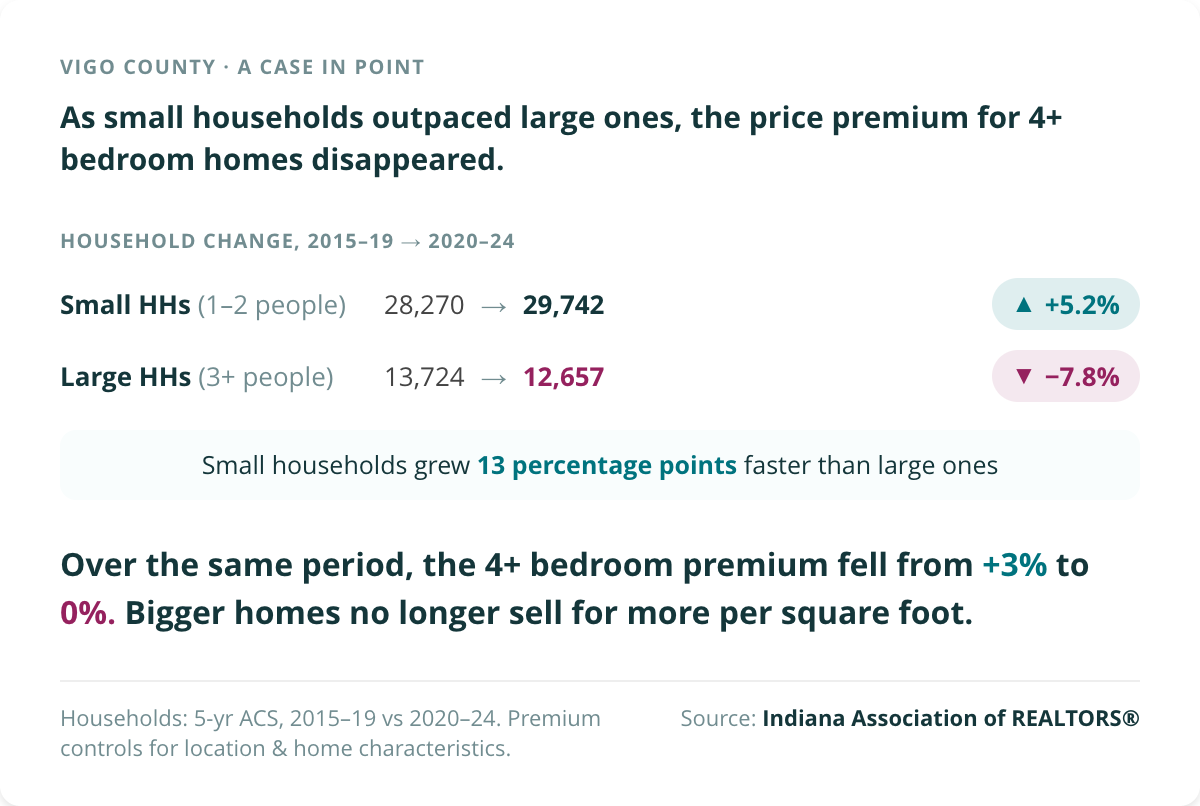
Splitting Indiana's 92 counties into three groups by how quickly household size is shrinking shows the pattern over time. In counties where household size is falling fast, the price gap between small and average-sized homes narrowed sharply after 2022. In other counties, it barely moved.
Section FOUR: New Construction
The homes Indiana is building don't match the households Indiana is getting.
Every finding in this report so far points to a demographic need for starter homes and downsizing homes. Small households are the fastest-growing segment. Family-sized homes are losing their price premium. And yet, in 2019, 48% of new single-family homes in Indiana had four or more bedrooms. By 2024, that share had climbed to 54%. It's fallen by a couple points through 2026 so far, but it's still a majority of new construction MLS sales.
The counties where growth in small households outpaces large households are the same counties where we saw the family-home price premium eroding. But builders in those counties delivered the same big-home mix as builders everywhere else. In fact, those are the counties with the most 4+ bed new builds.
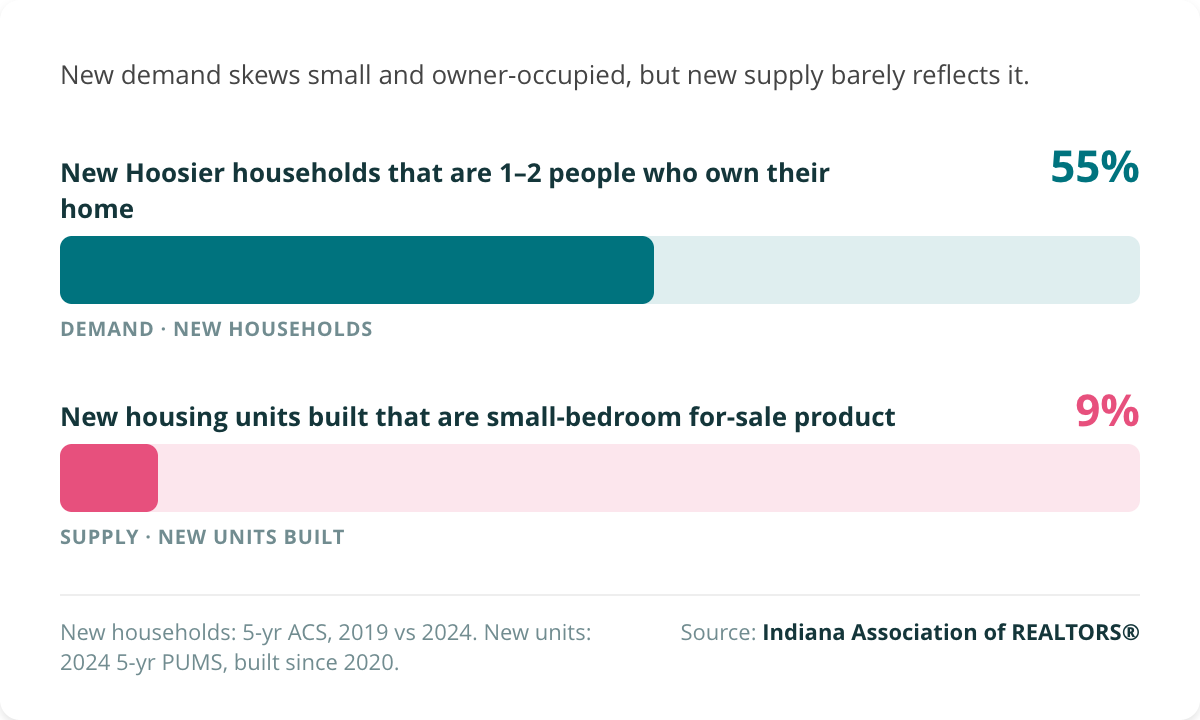
That is a six-to-one gap between the small households that Indiana is gaining and the starter homes that Indiana is building for them.
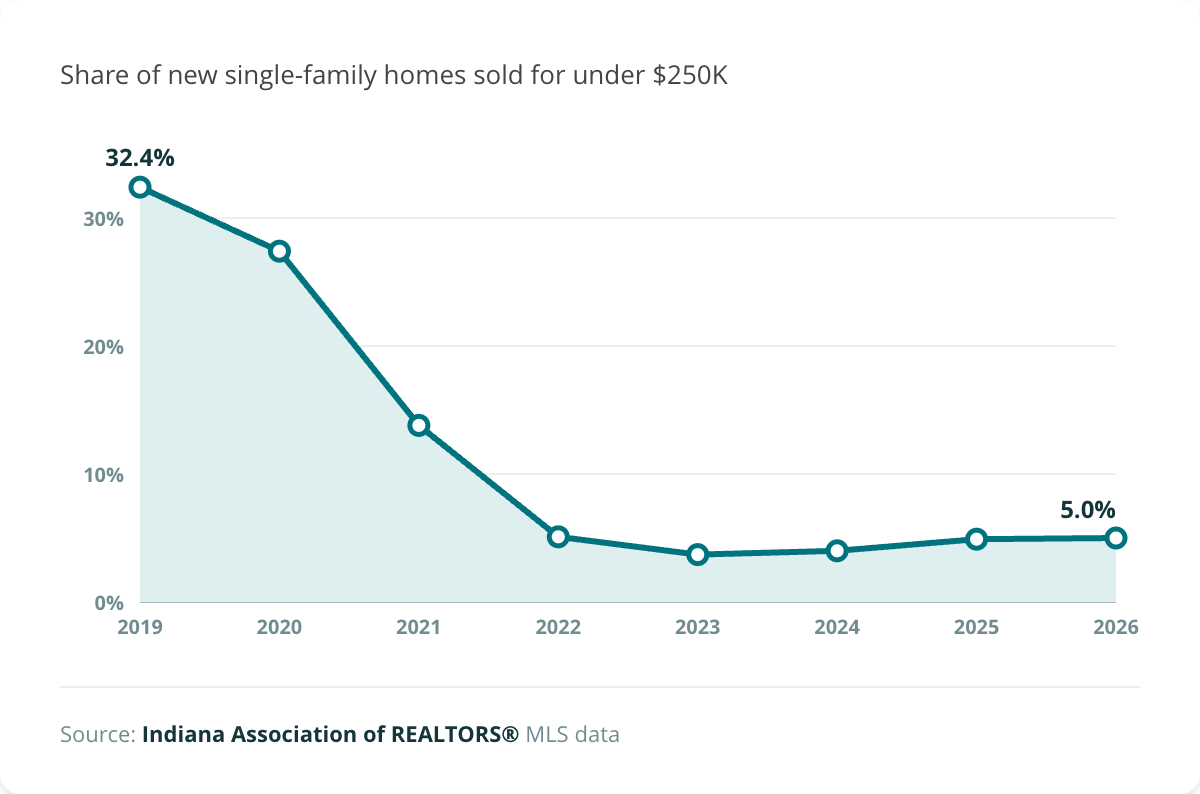
In 2019, 1 in 3 new single-family homes in Indiana sold for less than $250,000. By 2025, that fell to 1 in 20. Median new sizes barely budged, from 2,295 square feet down to 2,169. But the median price jumped from $295,000 to $380,000 in six years. Even mid-sized new construction is now well out of reach for typical first-time buyers. And smaller homes were always rare: new builds under 1,600 square feet were 15% of the market in 2019 and 16% in 2024.
Section Five: Land, lots, and the cost of building
Builders are behaving rationally, so what exactly is stopping the small, cheap house? We talk through the lot, the house, and regulation.
The Lot
In 1955, the median lot was 9,583 s.f. In 2023, it was exactly 9,583.
Lot size peaked at 17,300 s.f. in 1978 and has fallen ever since. Most of the decline happened in the 1990s (think "vinyl villages"). Lots have fallen by a fifth since 2014 (think "smart growth suburbia").
Builders preferred small-lot detached subdivisions to large lots in 2025. Large-lot subdivisions once made up 30% of the market in 2015. Now they make up 8%.
Does zoning keep lots large? Even where lot minimums are largest, actual lot size is around 7,000-8,000 s.f. In Westfield, Zionsville, and Fishers, the median lot is smaller than the minimum in any zone. By definition, most of their new construction must be negotiated in PUDs or with a variance.
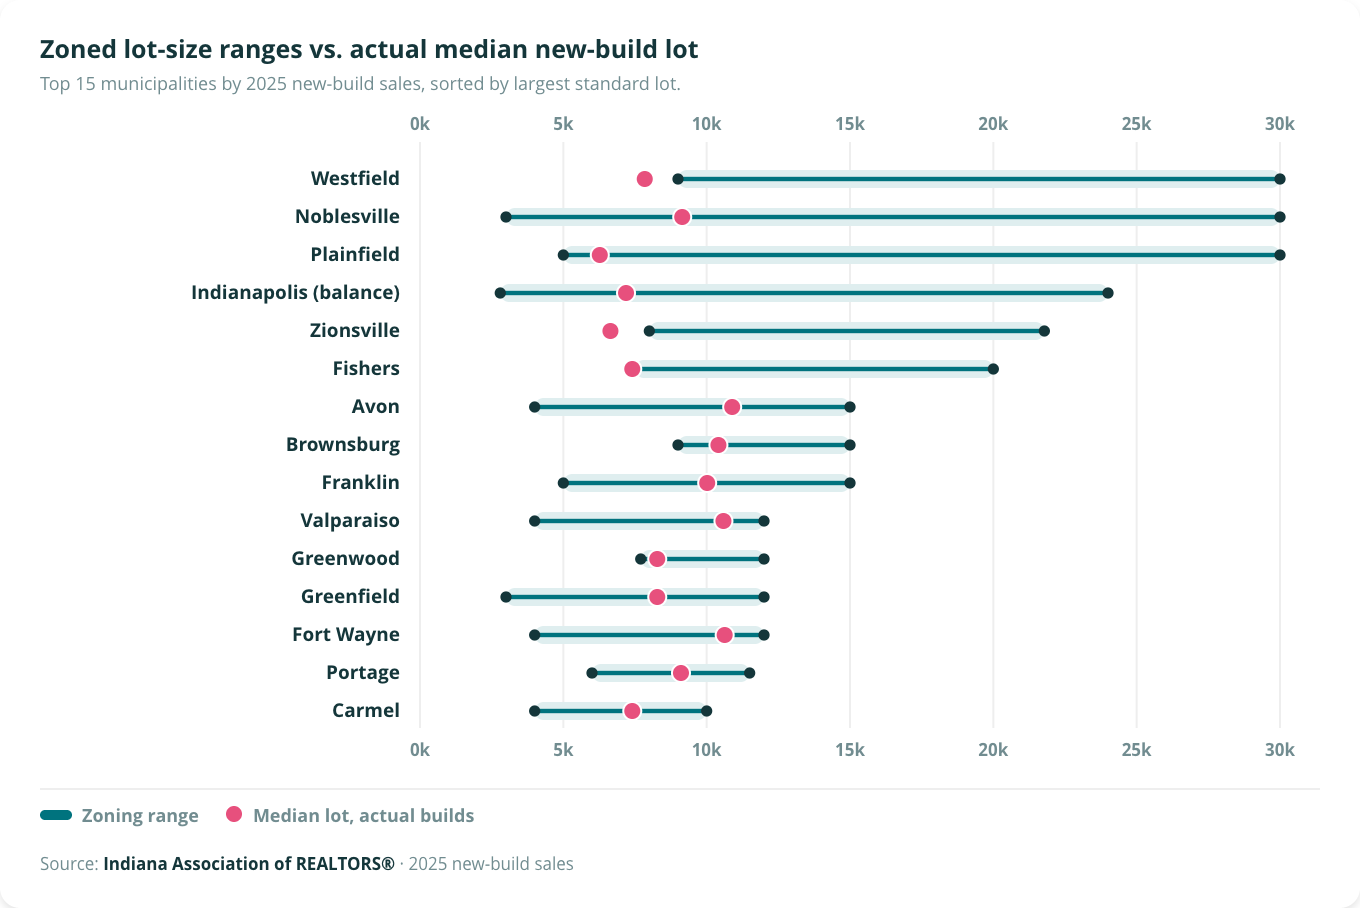
How we built this zoning chart: We reviewed zoning ordinances for the 50 largest cities and towns in Indiana. We recorded the largest and smallest lot minimums across all standard residential zones where detached single-family houses can be built by-right (excluding certain zones like estate, rural residential, or neighborhood conservation).
Indiana Zoning Library
We built a library of zoning ordinances for 50 cities and towns
View residential zones and source documents
The result is a new dataset and a new statewide resource: IAR's Indiana Municipal Zoning Library. This captures zoning ordinance source documents for 50 communities, and tabulates each residential zone in these places. This is a valuable resource for this and other future research efforts.
In 2025, almost half of the state's new construction fell into these communities (43%), but still 57% falls in other municipalities or counties with zoning we have not recorded yet, or into counties without zoning and lot minimums. (Source: DLGF sales disclosures)
For the 5,000 sales (out of 12,000) that had a subdivision name, we can construct the product mix within the subdivision. Developments dominated by small lots or attached product are 15-20% more affordable than those with standard lots. But they still don't get us back to a $250,000 home.
The House
What does it cost to build a house?
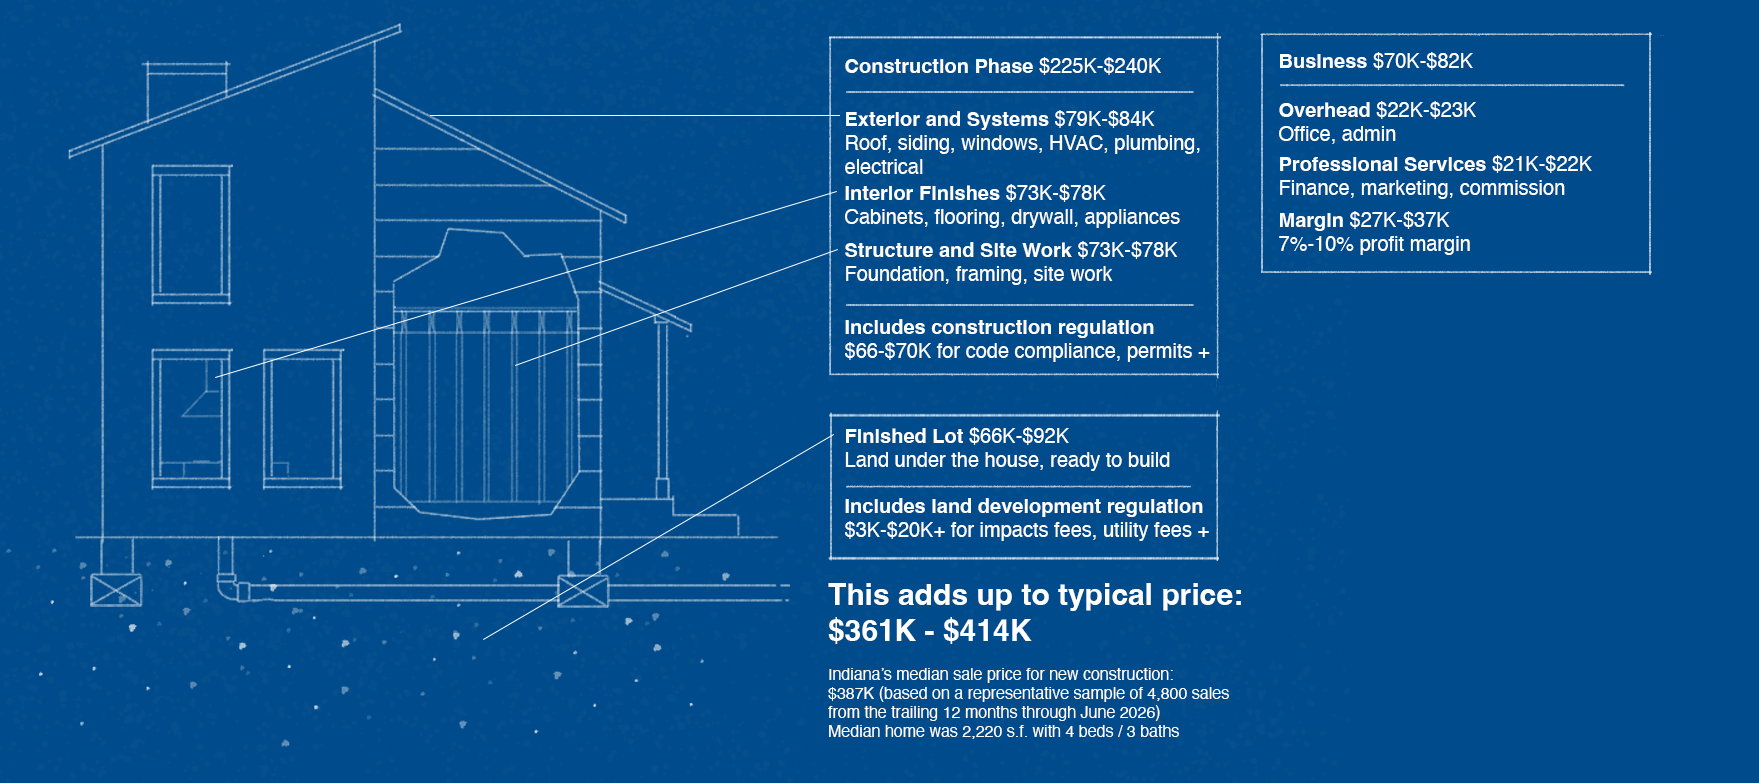
Appliances and systems don't directly scale with square footage. Even if we built 2-beds at scale, they wouldn't be $250K starter homes. The 2-beds we build in 2026 sell for $326,000 (and we could only find 114 of them). 26 of them sold for under $250,000.
The regulations
Typical impact and new construction fees
But limiting impact fees is not going to bring back the $250,000 starter home. Even if we eliminated them entirely, that would cut $3,000-$20,000 from the price, which is maybe 1%-5% of the sale price. And the policy debate is not even around eliminating them: they support critical systems like water, sewer, and parks.
Impact fees should be reformed for many good reasons, but we cannot expect radically more affordable housing from this policy change.
Zoning Districts with Lot Minimums
Builders are already building small-lot developments, but they often have to go through a lengthy Planned Unit Development or zoning variance process. We should make 1/8 acre lots buildable by right — consumers and builders both want this product, and zoning hurdles add cost. In the 50 communities we studied, 13% of new construction sits in the gap between the proposed 1/8 cap and the smallest lot minimum in the community. A by-right rule removes the negotiation needed to build these neighborhoods.
* 2025 DLGF sales disclosure, new construction within the 50 municipalities we studied
If a PUD process costs $50K-$250K and is spread over 100-300 lots in a subdivision, that adds roughly $500-$2,000 per home. Delays could add $700-$3,000 per home, assuming carrying land for 6-12 months at 8-10% interest. That is a wide range of about $1,000 - $5,000 per home. National estimates of zoning and delay costs are even higher: $9,500 per home according to NAHB.
This is real money, and should be reformed. But it's not why a new house costs $387,000.
Ranges: PUD soft costs and carrying costs spread per lot (authors' estimates). National anchor: NAHB, Government Regulation in the Price of a New Home (2026): zoning approval application $7,007 + development-phase delay $2,480 per home, averaged across all approval channels. By-right approvals run about 28% faster with less variance (Journal of the American Planning Association, 2022).
The biggest impact
Change the business model
Century Complete is Century Communities' no-frills, online-sales brand. They sold 132 new Indiana homes in 2025 at a median of $249,991, but only where land is cheap: the same product runs $326K in Porter County.
Change the Product
A builder in Princeton, Indiana sold detached homes at 1,284 s.f. each for $192K–$205K. These were a repeated plan in a place with no zoning (Gibson County) and cheap land.
A builder in Hancock County sold 39 townhouses at a median price of $233K on 2,400 s.f. lots.
A new courtyard-plat community in Marion County has entry homes (attached, 1,500 s.f.) at $235K–$246K on 4,000 s.f. lots.
Change the Construction Model
Harvard's Joint Center for Housing Studies priced the same house built two ways: a factory-built home costs 35–68 cents on the dollar to construct and install, depending on section type. The median new-build in Indiana (4 bedrooms, 2,220 s.f.) could cost $280K as a manufactured home. A two-bedroom home could cost as low as $218K.
* Modeled estimates, low end of range: we applied the Harvard JCHS double-section cost ratio (65¢ on the dollar) to the construction lines of our benchmark cost stack, leaving the lot, overhead, professional services, and a 10% builder margin unchanged. See Methodology.
1974 — Federal HUD code requires every manufactured home to sit on a permanent steel chassis; the trailer profile becomes law.
2019 — IHCDA funds a $1M pilot: modular homes from Indiana factories on cleared blight lots in Marion and Elkhart.
2024 — HUD modernizes the code: up to four units per factory-built structure, routine designs no longer need case-by-case approval.
2026 — Congress ends the chassis requirement and raises FHA loan limits for manufactured homes (21st Century ROAD to Housing Act, July).
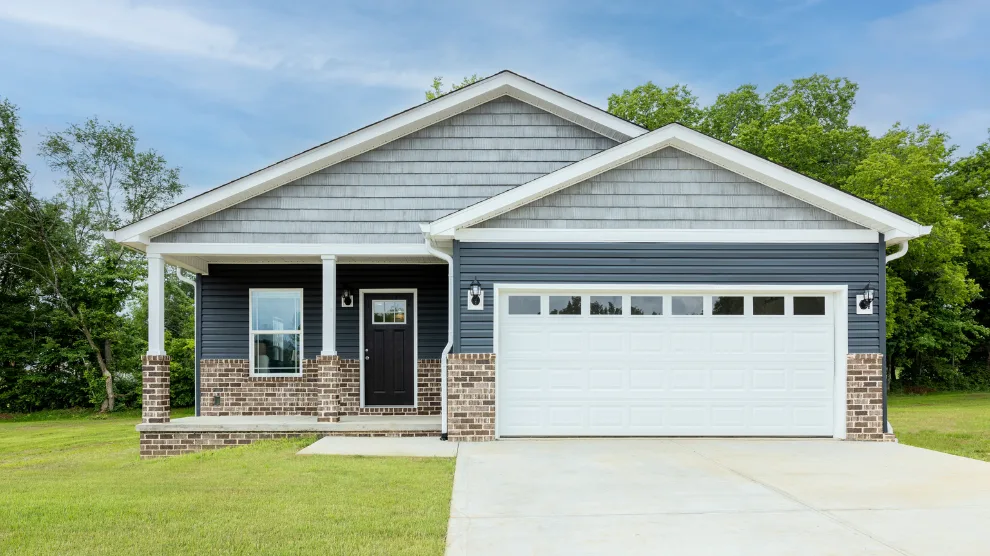
This is a CrossMod home: factory-built to HUD code, pitched roof, garage, permanent foundation. Fannie Mae and Freddie Mac appraise it against site-built homes and finance it with a conventional mortgage. Colorado firms are building entire workforce-housing neighborhoods this way. Indiana's Elkhart-area factories build this product today for export to other states.
Image: Clayton Homes
Reforming zoning, fees and development standards removes friction in the new construction pipeline that skews the market towards larger homes when builders could profitably be thinking smaller—smaller lots and smaller homes to fit smaller households. Removing regulatory barriers to building also harnesses market forces to improve affordability; rising inventory has a positive and significant relationship with slowing price appreciation.
Ultimately, focusing on smaller, more affordable options serves two fast-growing household cohorts—first-time owners and downsizing seniors whose moving choices, in turn, make room for new migrants and growing families.
County typology (k-means clustering). We grouped Indiana's 92 counties into five categories based on how much of their 2020–2025 population change came from natural change (births minus deaths), domestic migration, and international migration. K-means clustering is a standard method for finding groups of counties that look demographically similar to each other. The five clusters — Boomtowns, Migration-driven, International gateway, Natural-driven, and Stable — describe how a county's growth broke down, not simply how fast it grew.
Country-of-birth analysis. Foreign-born counts by country of origin for gateway counties came from ACS tables B05006 and B05007.
Household compression math. Indiana added 146,000 net new households between 2019 and 2024. About 81,000 came from population growth at the 2019 average household size. About 65,000 came from that average household size falling from 2.52 to 2.46 people per household. The two effects sum exactly to the observed total.
County compression metric. For each county, we measured how much faster 1-and-2-person households grew than 3+ person households, normalized to the county's 2019 base. Higher values indicate stronger compression.
Owner-household decomposition. Between 2019 and 2024, Indiana added roughly 150,000 net new owner-occupied households. We split that total into three parts using a standard demographic decomposition (Kitagawa shift-share):
Recent-mover buyer flow. The PUMS variable MV ("when moved in") records how recently the current household moved to its home. To approximate the flow of small-household home purchases, we counted 1-and-2-person owner-occupied households whose head-of-household moved in within approximately the last five years. It's not a perfect transaction count — a small share reflects inheritance or family transfers, and the five-year cutoff is approximate — but it captures the buying flow more directly than any stock-based approach.
Interstate migration counts. Using the PUMS variables MIG (moved in the past year) and MIGSP (state of prior residence), we identified households whose head-of-household lived in a different state or country one year before their survey. Because 5-year PUMS weights reflect average annual counts rather than five-year cumulative totals, the reported figures represent typical annual arrivals during each window.
A note on decompositions. Splitting a net change into buckets is a mathematical convention, not a physical claim about individual behavior. The Kitagawa split we use here is a standard choice in demographic analysis; different decomposition approaches — cohort-based, migration-first — would produce different attributions of the same 150,000 net change. All splits sum to the observed change; each highlights a different mechanism.
Price-per-square-foot model. We fit a regression predicting the logarithm of sale price per square foot on bedroom count interacted with sale year, adjusting for square footage, home age, bathrooms, lot size, property type (single-family detached, townhouse, condo, other), basement, garage, fireplaces, central air, heating type, and calendar month of closing. Fixed effects for ZIP code absorbed average price differences between neighborhoods. The model was fit on all 605,703 MLS sales and explained about 60% of the variation in price per square foot (R² = 0.60).
Household-shrinkage heterogeneity test. To test whether counties with faster household shrinkage saw larger declines in the 4+ BR price premium, we used a two-stage approach. First, for each of the 84 counties with sufficient sales in both windows, we estimated the bedroom-adjusted price gap in 2019–2020 and separately in 2023–2024. Then we regressed the change in the 4+ BR premium (post minus pre, in percentage points) on the county's growth-rate difference — the percentage-point gap between small-household (1-2 person) and large-household (3+ person) growth from 2015-19 to 2020-24 — controlling for the county's baseline premium level and 2019 market conditions, weighting each county by the inverse variance of its estimate. Every 10-percentage-point difference in favor of faster small-household growth predicted about 0.8 percentage points more erosion in the 4+ BR premium (weighted least squares, β = −0.077, p = 0.10, R² = 0.40).
Construction mix. New single-family construction counts and bedroom mixes come from BPS annual county-level data supplemented with MLS records tagged as new construction (Census codes Y, SPEC, and CUSTOM). All new-construction analyses draw on both sources; existing-home analyses in Section 3 exclude MLS new-construction records.
Zoning minimums dataset. We compiled the minimum lot size of every residential zoning district in 50 Indiana cities and towns — 217 districts in all — directly from each municipality's published zoning ordinance or unified development ordinance, and verified each entry against the ordinance text in July 2026. Each district also carries a classification (standard, estate, rural, special, or open-land) so that summary statistics compare like with like. Two summary measures are used in the report: the smallest lot allowed by right in any residential district (computed across all districts), and the largest minimum among standard districts (computed after excluding estate, rural, special, and open-land districts, which exist for reasons other than ordinary subdivision development). Where a district sets no explicit lot minimum but caps density, we derived an effective minimum from the density cap. This dataset is descriptive of ordinance text; it does not capture planned-unit-development approvals, variances, or other negotiated departures — which is precisely the gap between "paper" and "built" that Section 5 measures.
Identifying new-construction sales. The sales disclosure files do not label new construction, so we identified it by seller. A seller-classification pipeline — name standardization, a hand-reviewed lookup of every high-frequency seller in the 2025 file, and keyword rules for builder and developer naming patterns — tags each sale as coming from a builder/developer or not. A sale then counts as a comparable new home if it is a developer sale of a single improved parcel (the disclosure's vacant-land flag is "N"), is marked valid for trending by the assessor, and closed for at least $50,000. We deliberately did not filter on the "new residential platted lot" property class, because in the older files roughly half of genuinely new homes still carried the generic residential class, awaiting their first full assessment. This definition yielded 5,327 comparable new-home sales in the 2015 file, 7,497 in 2020, and 12,013 in 2025.
Historical files and the seller-name audit. The 2015 and 2020 disclosure files use an older format that truncates and mangles company names (for example, D.R. Horton appears as "D LLC"). Because a missed builder is a missed new home, we audited every high-volume seller the automated pipeline left unclassified and recovered the mangled brands by hand — adding about 26% more sales in each historical file. We then stress-tested the report's affordability finding against classification error: under the most aggressive possible assumption (treating every repeat entity seller as a builder), the share of new homes under $250,000 in 2025 dollars moves by no more than about four percentage points in either historical year. The collapse of the under-$250K new home — roughly 29% of new-home sales in 2015 to 8% in 2025 — survives every classification scenario. (Note: when we measure the collapse of new homes under $250,000 from MLS data, we see a similar trend: The share falls from 32% in 2019 to 5% in 2026.) One further caution: disclosure capture and classification coverage differ across years, so the three vintage samples are used for shares, medians, and distributions, never as counts of construction volume (BPS is the volume source).
Lot sizes for historical sales. In the older disclosure format, the reported parcel acreage frequently describes the parent parcel before subdivision rather than the lot that sold. Lot sizes for 2015 and 2020 sales therefore come from the sold parcel's assessed acreage in the 2023 statewide assessment file, joined by parcel number; the acreage printed on the old disclosure forms is not used.
Lot size by year built. The 70-year lot-size series comes from the statewide assessment data rather than from sales: we joined the parcel table (deeded acreage) to the improvement table (year constructed) and the dwelling table (finished living area, bedrooms), keeping residential parcels with a single dwelling — 953,768 parcels statewide. Grouping by year built gives the median lot size, the share of lots at or under an eighth of an acre, the median finished living area, and the building-footprint-to-lot ratio for each construction vintage from the 1950s forward. Two caveats: the series describes the surviving housing stock (homes demolished since construction are absent), and lot boundaries are measured as of the current assessment rather than as originally platted, though splits and combinations of platted subdivision lots are rare.
Community (subdivision) typology. The 2025 disclosure file records a subdivision name; the older files do not. To classify historical sales by community, we built a statewide parcel-to-community map from the legal descriptions in the assessment data, extracting the plat name (the text preceding the first "LOT" reference) and normalizing away section, phase, and unit suffixes. About 45% of residential parcels carry a plat name, and 75-78% of historical new-home sales matched a community. Each community was then typed by its lot-size distribution: townhome/attached if at least 60% of its lots are under 3,000 square feet (a threshold chosen at the natural valley in the statewide lot-size distribution, which separates attached from detached product), small-lot detached if the median lot is under 7,000 square feet, standard between 7,000 and 12,000, and large-lot above 12,000. The same definitions were applied to all three vintages so the type shares are comparable across time.
Assigning sales to municipalities. Sales and parcels were assigned to cities and towns by point-in-polygon spatial join against Census TIGER/Line 2024 incorporated-place boundaries — not by the mailing-address city, which routinely disagrees with corporate limits (unincorporated areas share post-office names with adjacent cities).
The $250,000 test. Prices for two-bedroom new construction come from MLS records flagged as new construction: 554 two-bedroom detached closings statewide in 2024-2026, reported statewide and split between the Indianapolis metro and the rest of the state. MLS new-construction coverage is thin before 2023, so the 2019 comparison point is reported as indicative. Alongside the market evidence, we built a simple cost model of a 1,150-square-foot two-bedroom ranch, combining national per-square-foot construction costs from NAHB's 2024 construction-cost survey [5] with per-unit costs that do not scale with house size — finished lot, regulatory compliance [2], financing, overhead, and margin. The model's purpose is directional: it shows that the largely fixed per-unit cost stack, not the marginal square footage, is what holds the floor under new-home prices. Published price figures in Section 5 come from the MLS and disclosure records; the cost model is corroborating context.
Inflation adjustment. Historical sale prices are expressed in 2025 dollars using the Bureau of Labor Statistics CPI-U (annual averages; the 2025 figure is preliminary pending the full-year average). [12]
The factory-built scenario. To estimate what factory construction would do to new-home prices, we re-ran the cost stack with one change: the construction lines (physical construction plus construction-phase regulation) multiplied by 0.65, the double-section manufactured cost ratio from Harvard's Joint Center for Housing Studies comparison of manufactured and site-built costs (construction plus installation, 2020 pricing). The finished lot, overhead, professional services, and 10% margin were left unchanged, since factory construction does not reduce them. This prices the benchmark 2,220 sf home at roughly $280–314K (vs. $380–420K site-built) and the 1,150 sf two-bedroom at $218–260K — the only configuration in our analysis in which a $250,000 price falls inside the modeled range without below-market land. These are modeled estimates applying a national cost ratio to Indiana's stack, not quotes; they also assume away the financing, appraisal, and zoning barriers that HUD-code homes currently face.