

Every widget pulls the latest numbers for the market you choose.
New to the app? These two get you from install to your first graphic.

Connect Your IAR Account
Link your membership once and unlock weekly data and ZIP code markets.
Getting Started with IAR's Canva App
Open the app, pick your market, and drop live stat cards into a design.
Use these as your default weekly and monthly workflow.
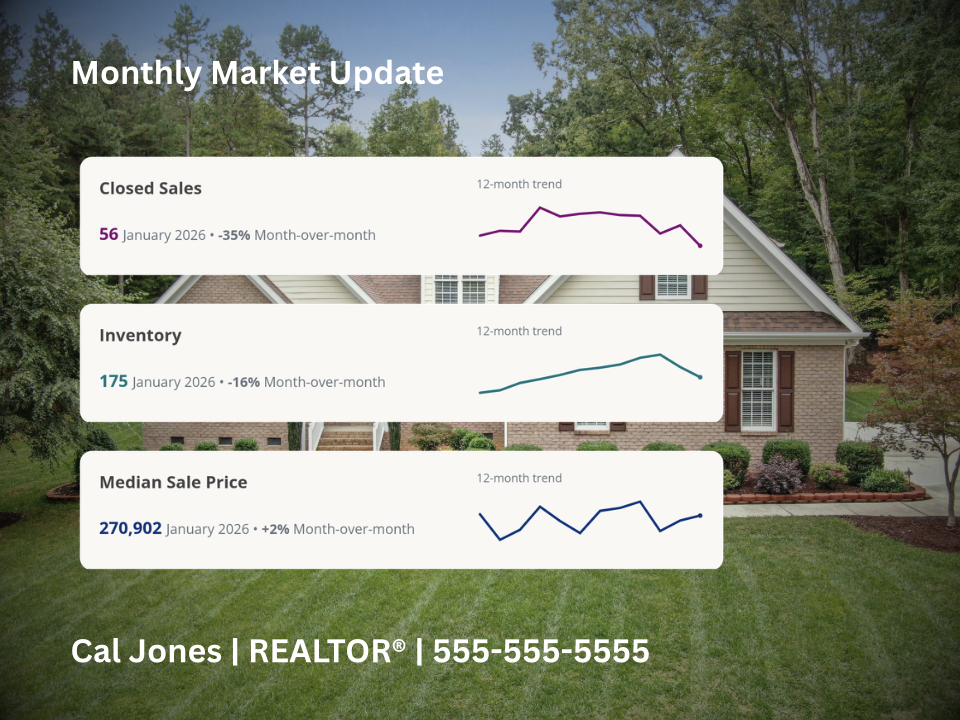
Monthly Market Post
The fastest way to create a clean market update using just a few key metrics.
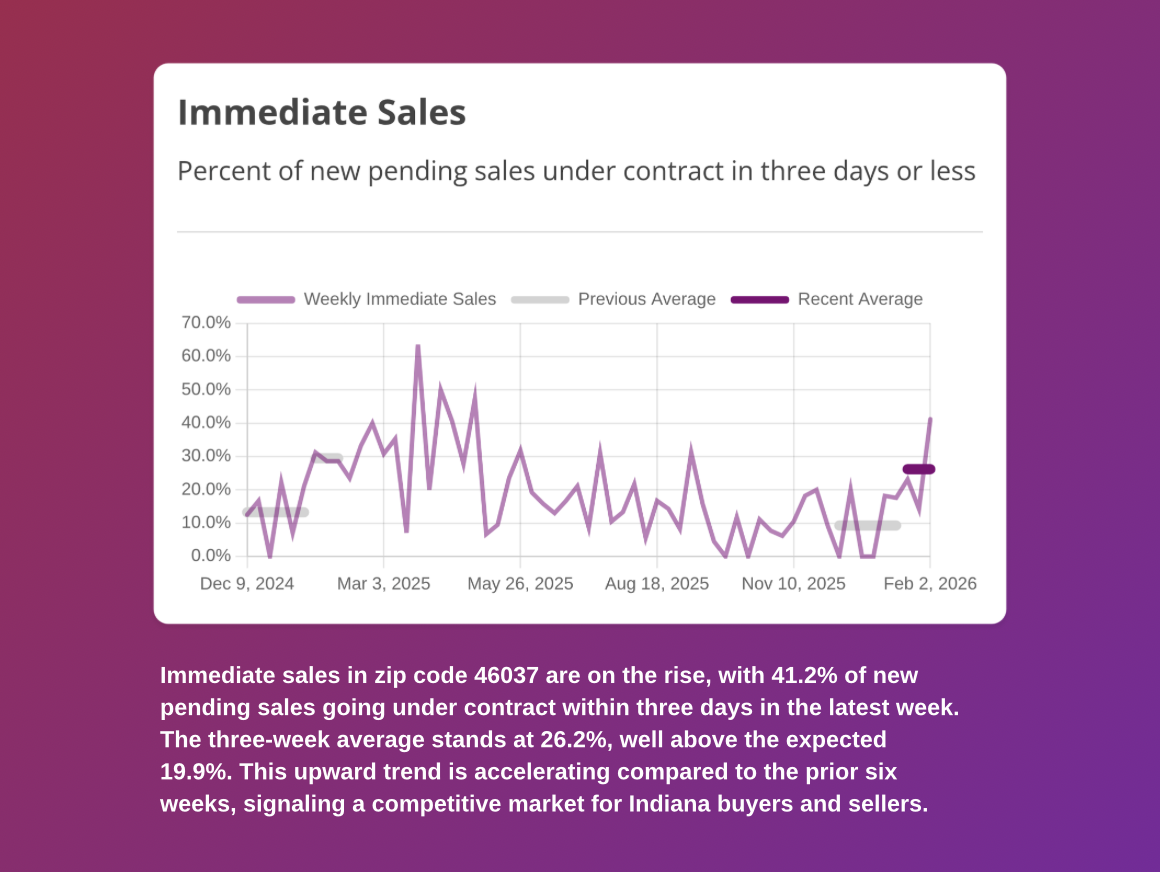
One-Metric Story Slide
Let a single chart carry the message and add one clear takeaway line.
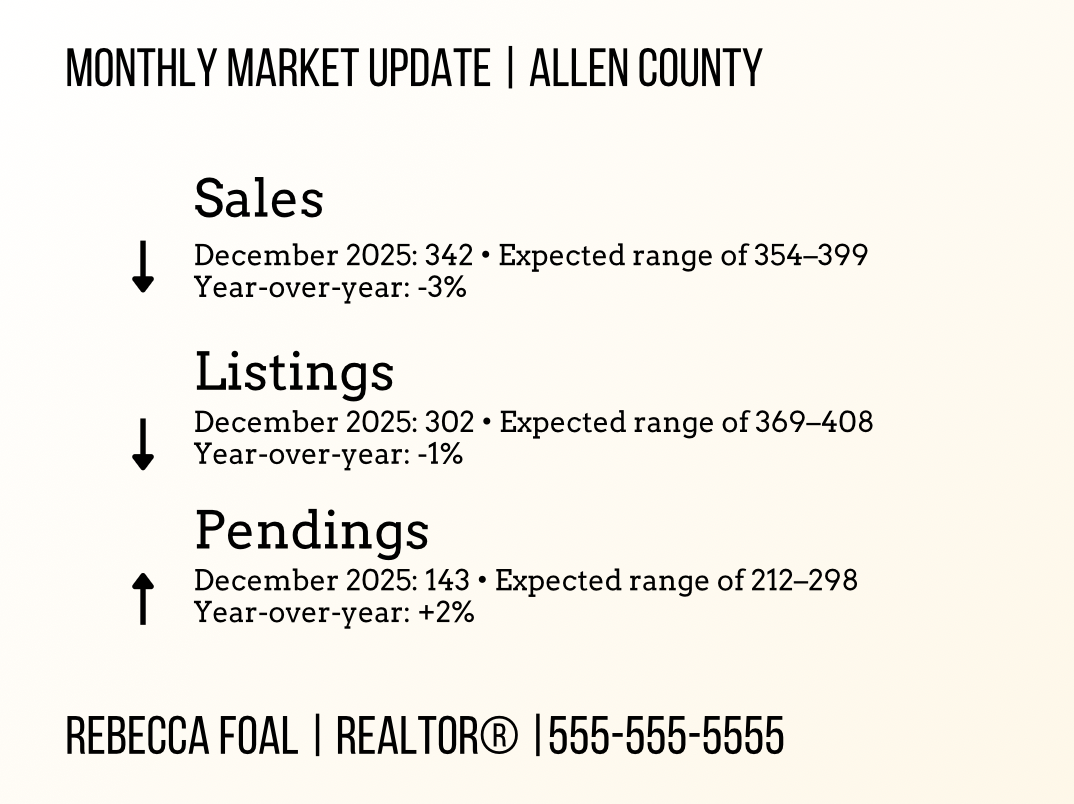
Text-Only Market Update
Read the fresh numbers off a text summary and drop them into your own template.
Real posts, real layouts. Steal the structure.

Comparison to State
Two simple cards comparing market dynamics to the state average.
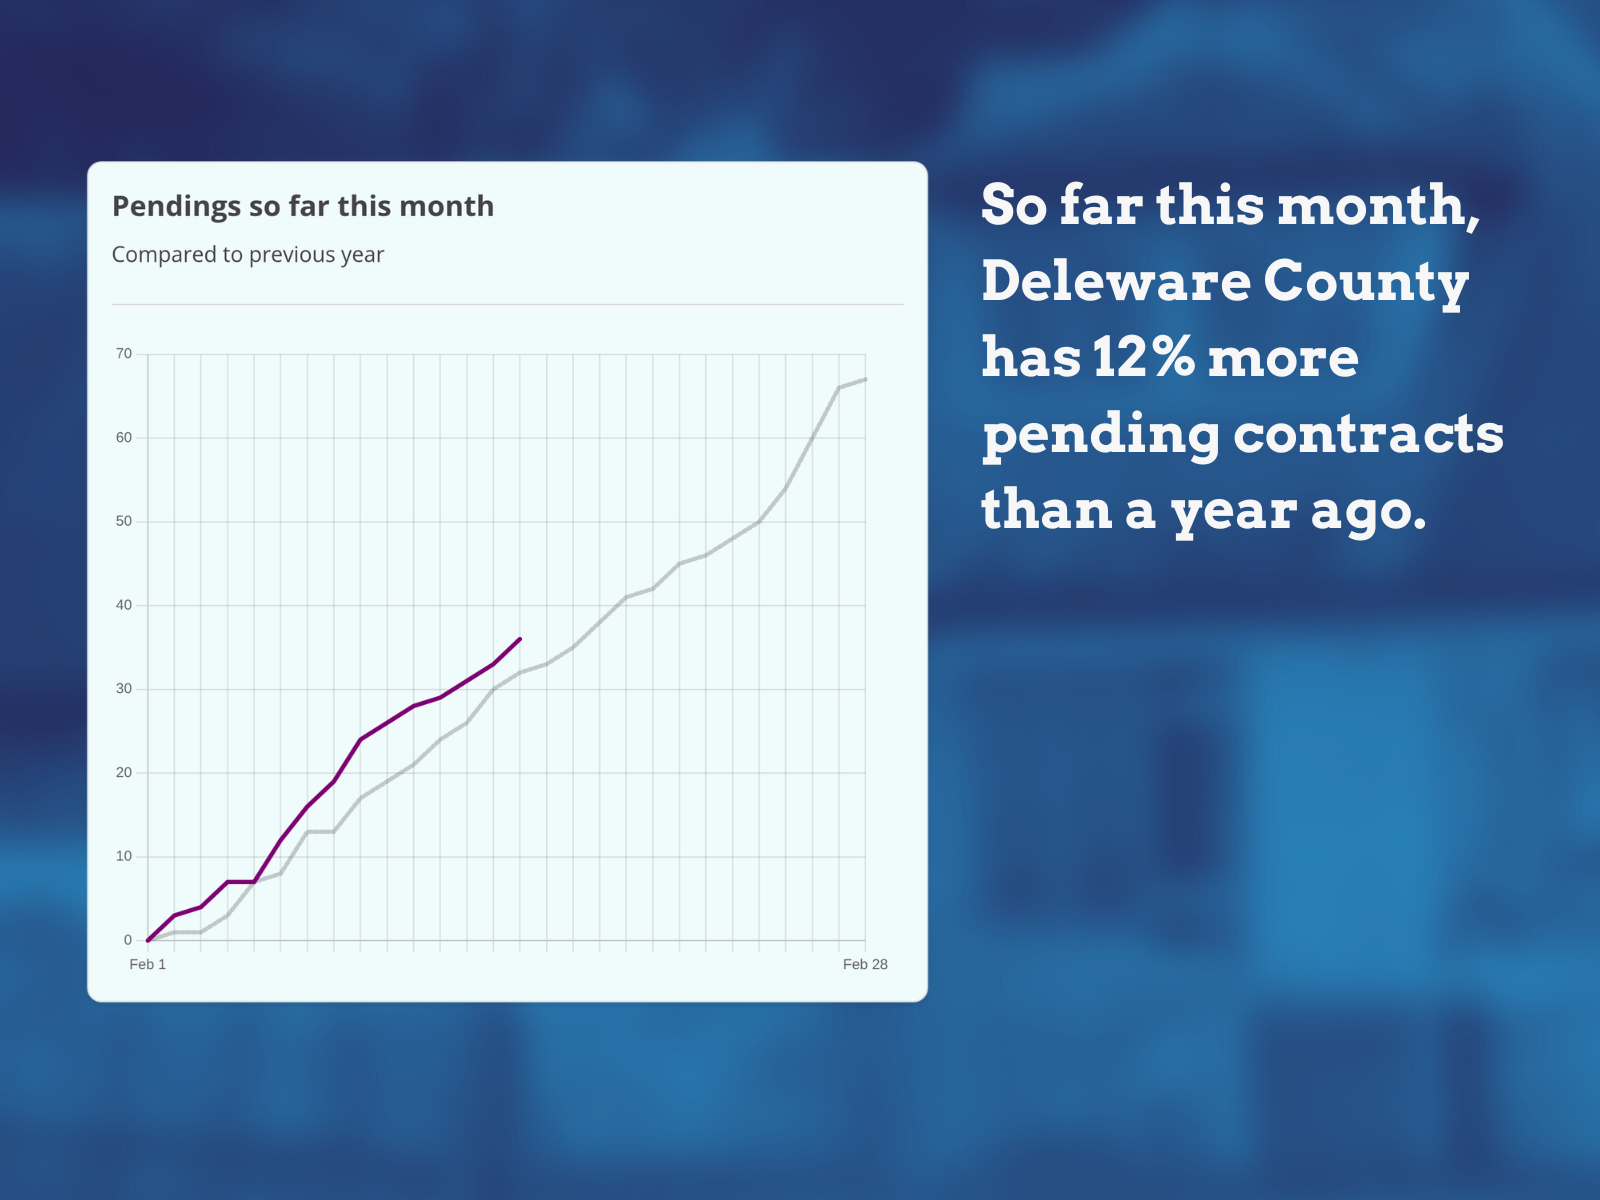
Daily Pendings Snapshot
A clean “as-of today” indicator that shows where demand is tracking versus last year, with a simple takeaway headline.
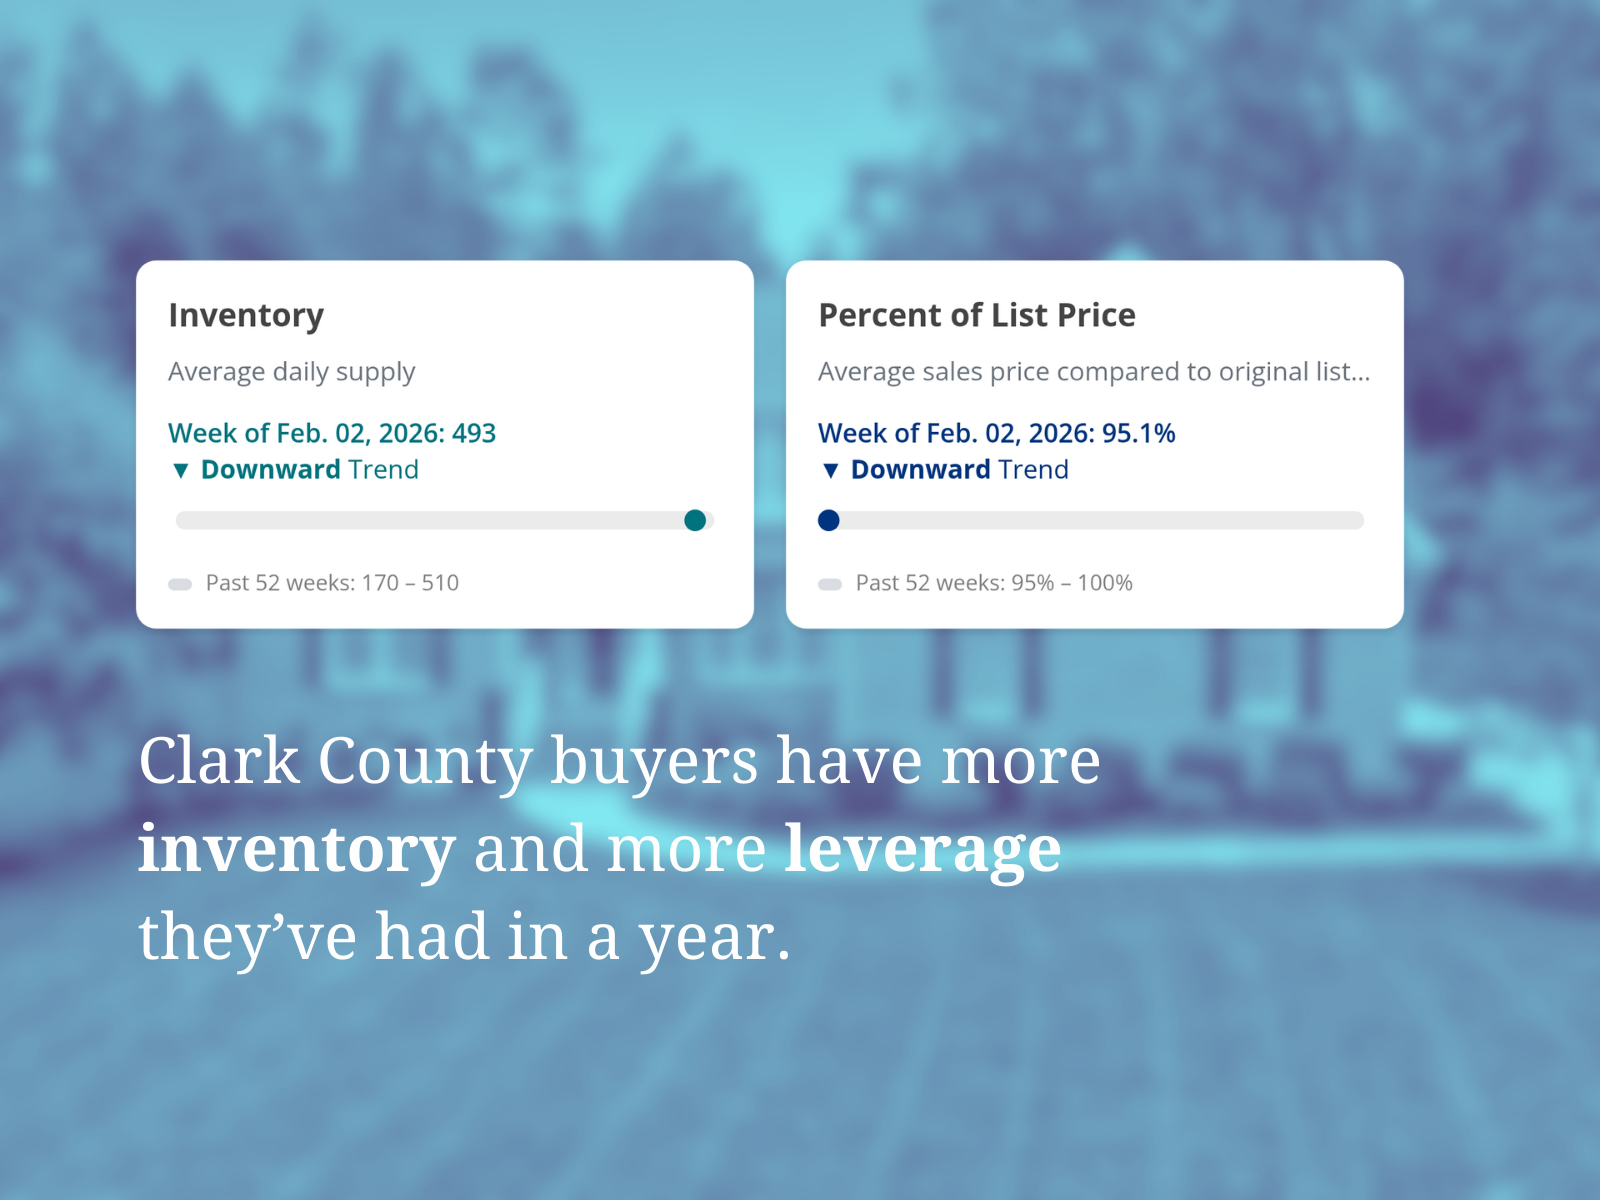
Encourage Buyers About Market Conditions
Use range plots to see how a current metric compares to the past year

Rolling Average with Custom Color
A clean chart with a custom color using a rolling average to reduce noise in small markets.

Small Cards with Light Background
Metrics from one topic—pricing dynamics—educate consumers and show depth of knowledge.
Saved sets live on your device. They remember your market, selected metrics, and widget choice so you can load and skip setup next time.
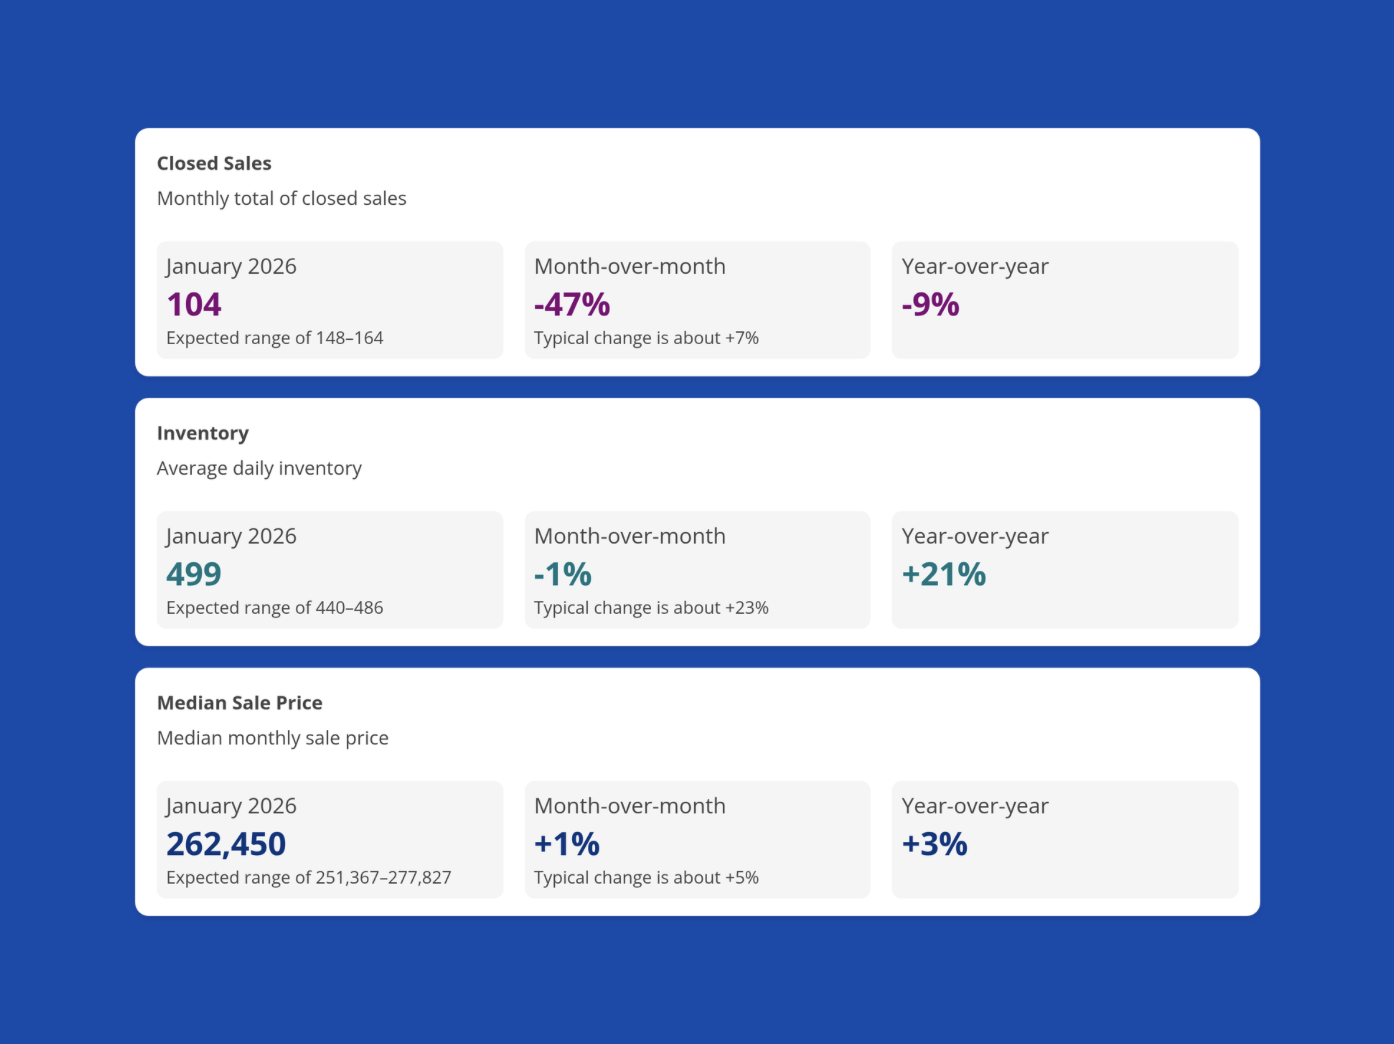
Saved Sets: Reuse a Monthly Template
Save a market, metrics, and layout once—then load and insert it in seconds next time.