Open the app, pick your market, and drop live stat cards into a design.
In the Canva editor, click Apps in the left sidebar and search for IAR Housing Hub. Open it and the panel appears with a green Connected to IAR badge when your account is linked.
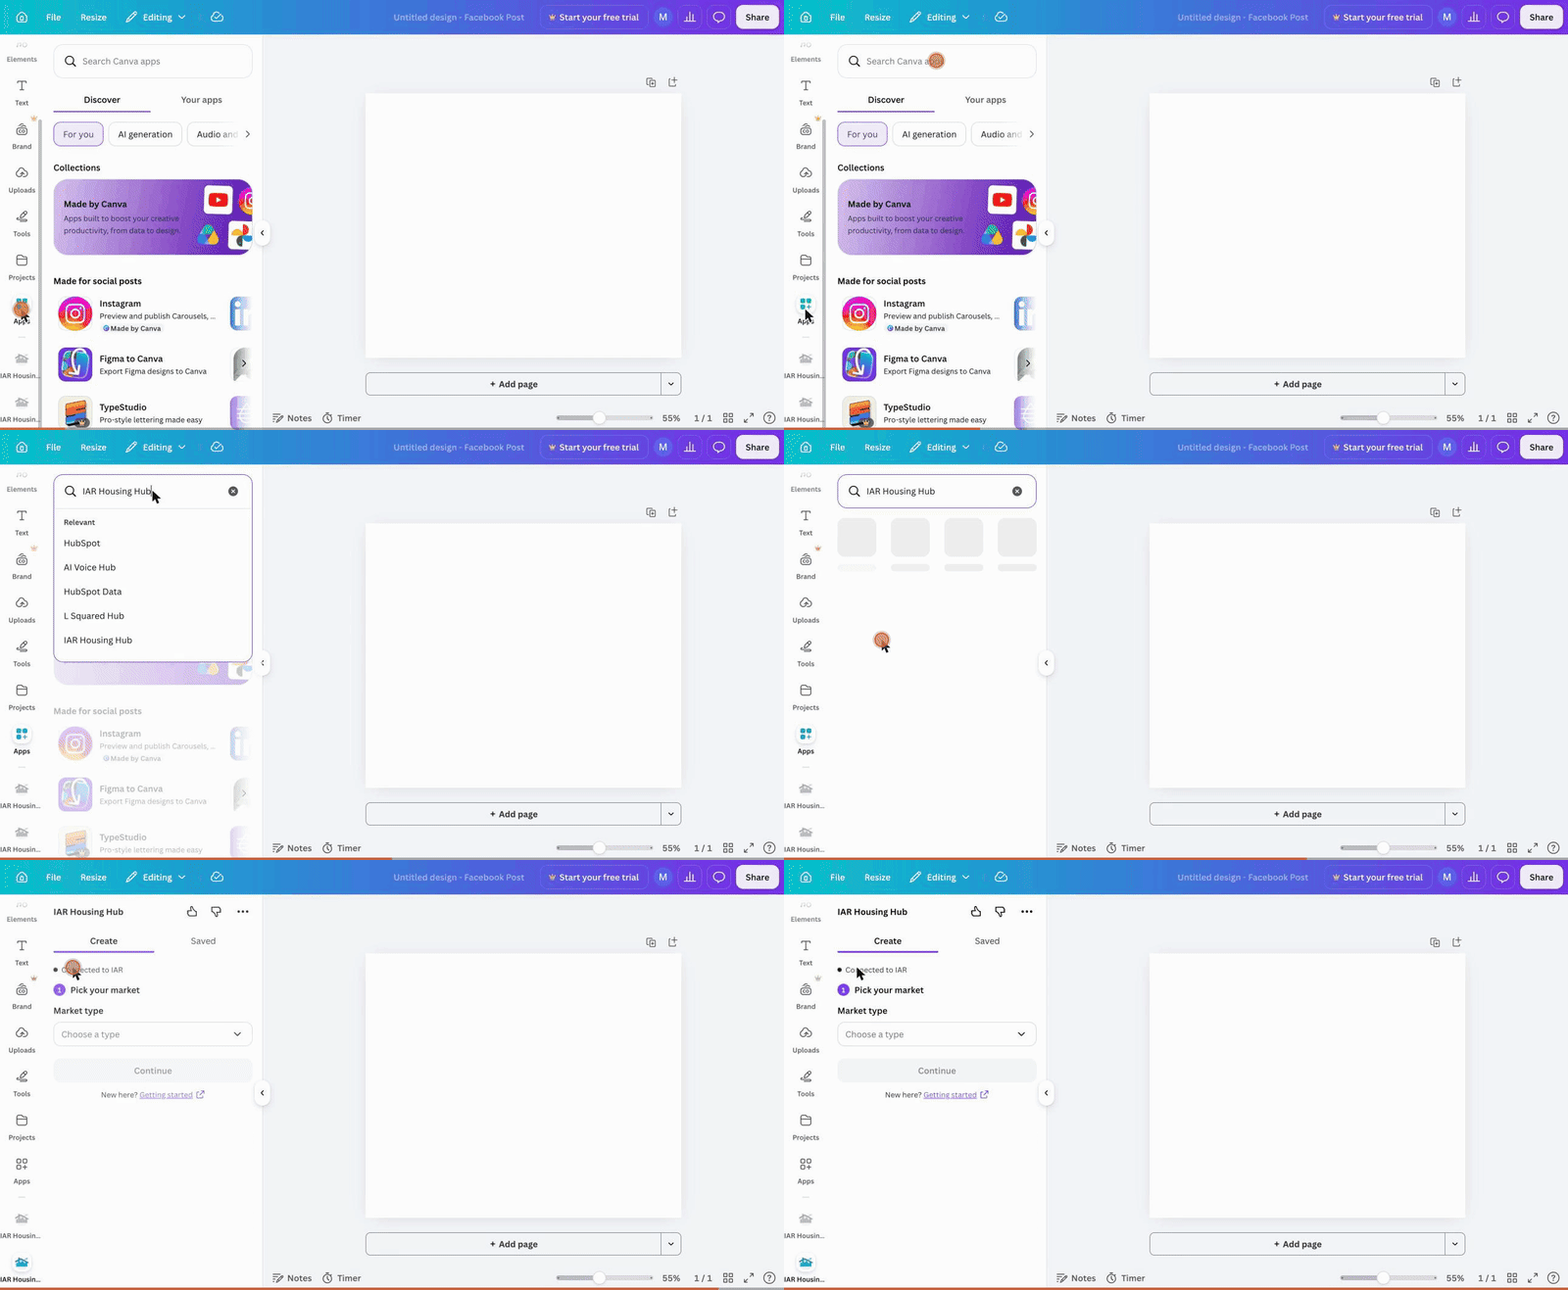
Find it once and Canva keeps it pinned in your sidebar.
Choose a market type, county, state, township, or ZIP code, then search for yours and hit Continue. Every market in Indiana is in there.
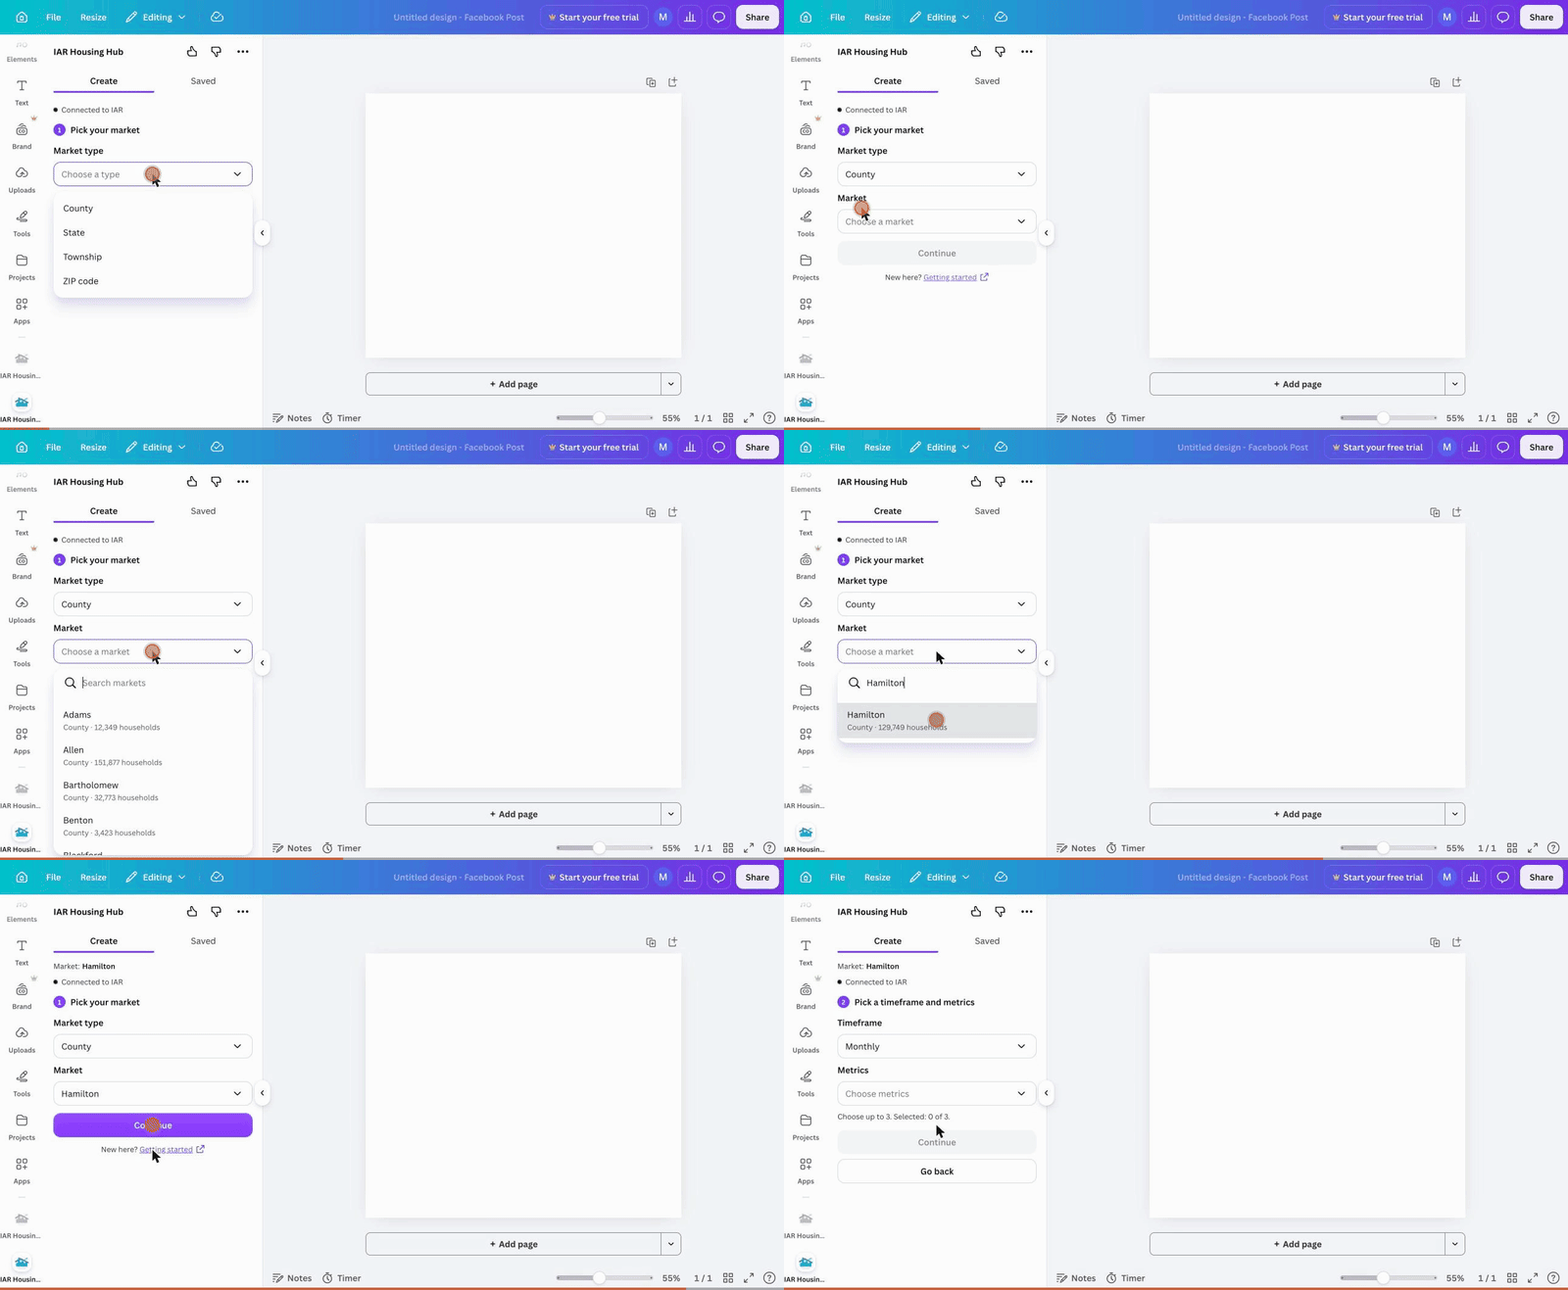
Pick the market you actually work, right down to the ZIP.
Keep the monthly timeframe and pick up to three metrics, like closed sales, inventory, and median sale price. The picker suggests the ones brokers reach for most.
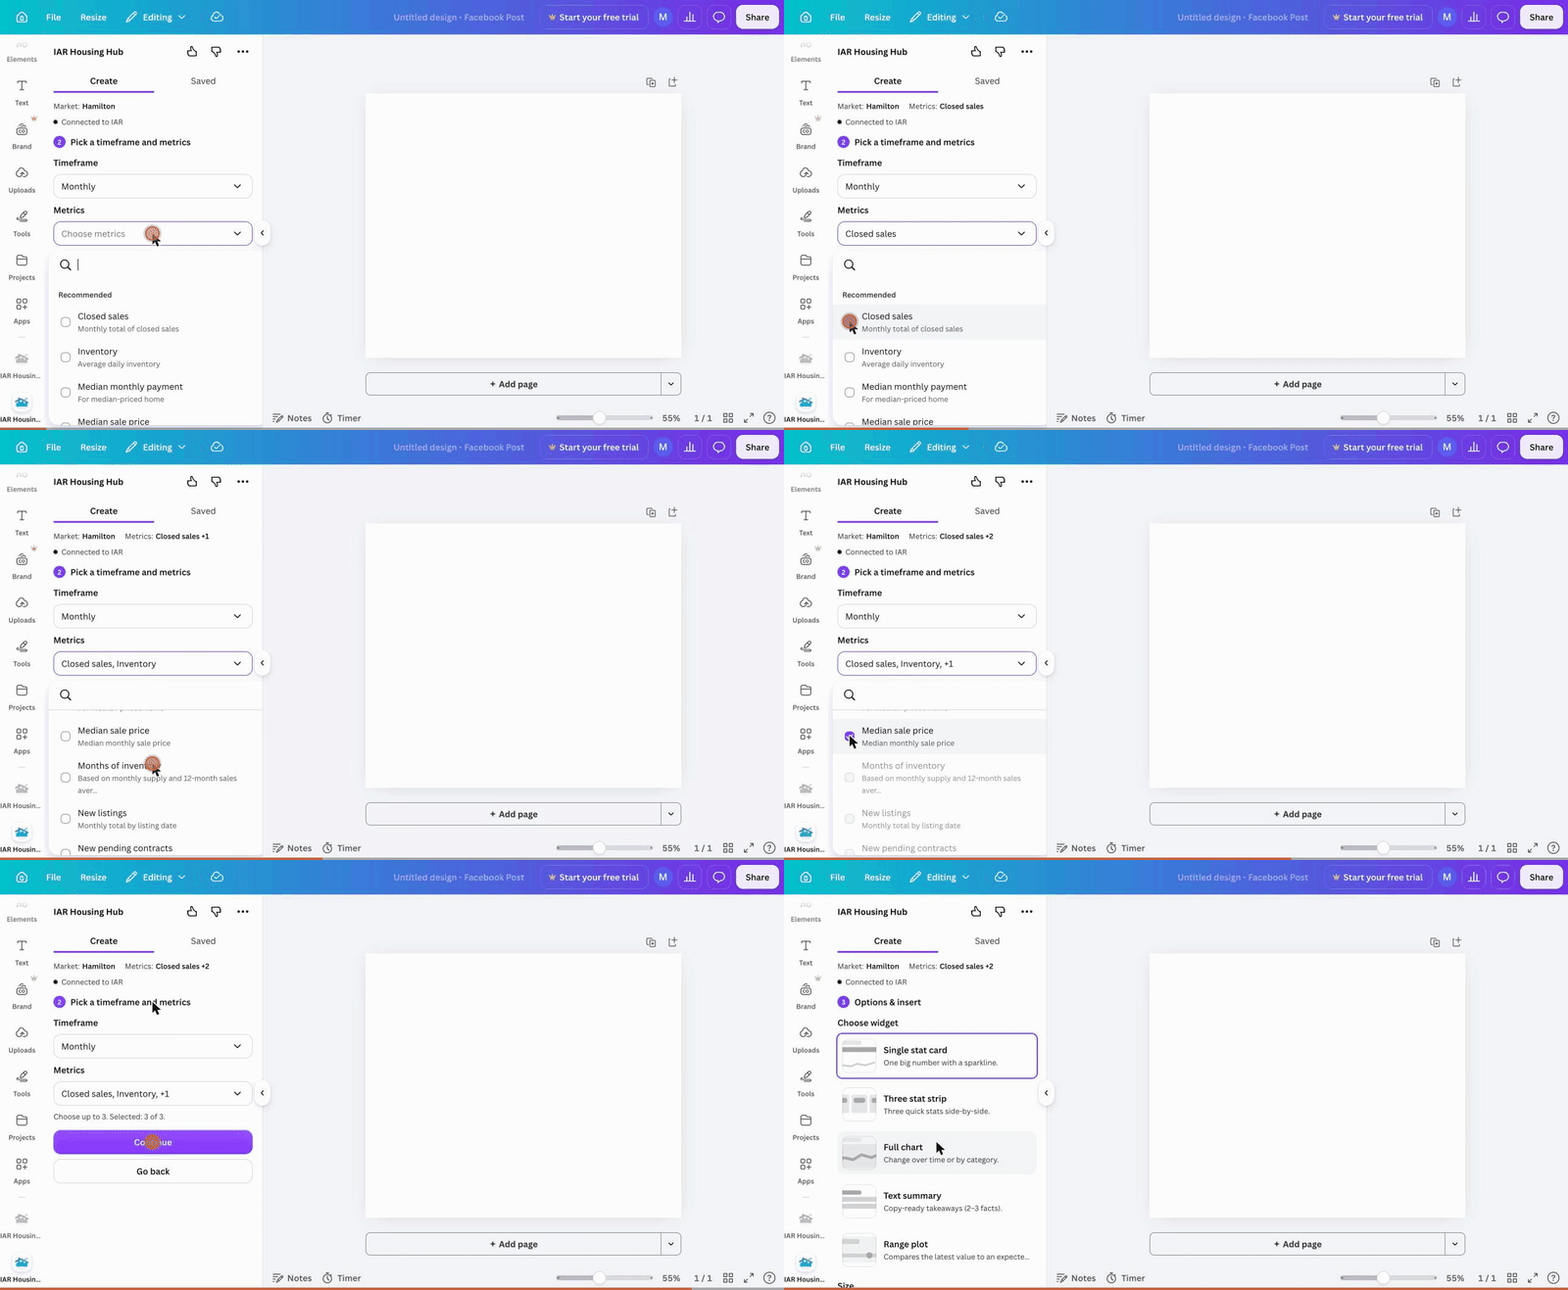
Three metrics is plenty for one graphic.
Pick a widget, a stat card, a three stat strip, a full chart, and more, then click Add to design. Finished cards land on your canvas with the latest numbers, sourced to IAR.
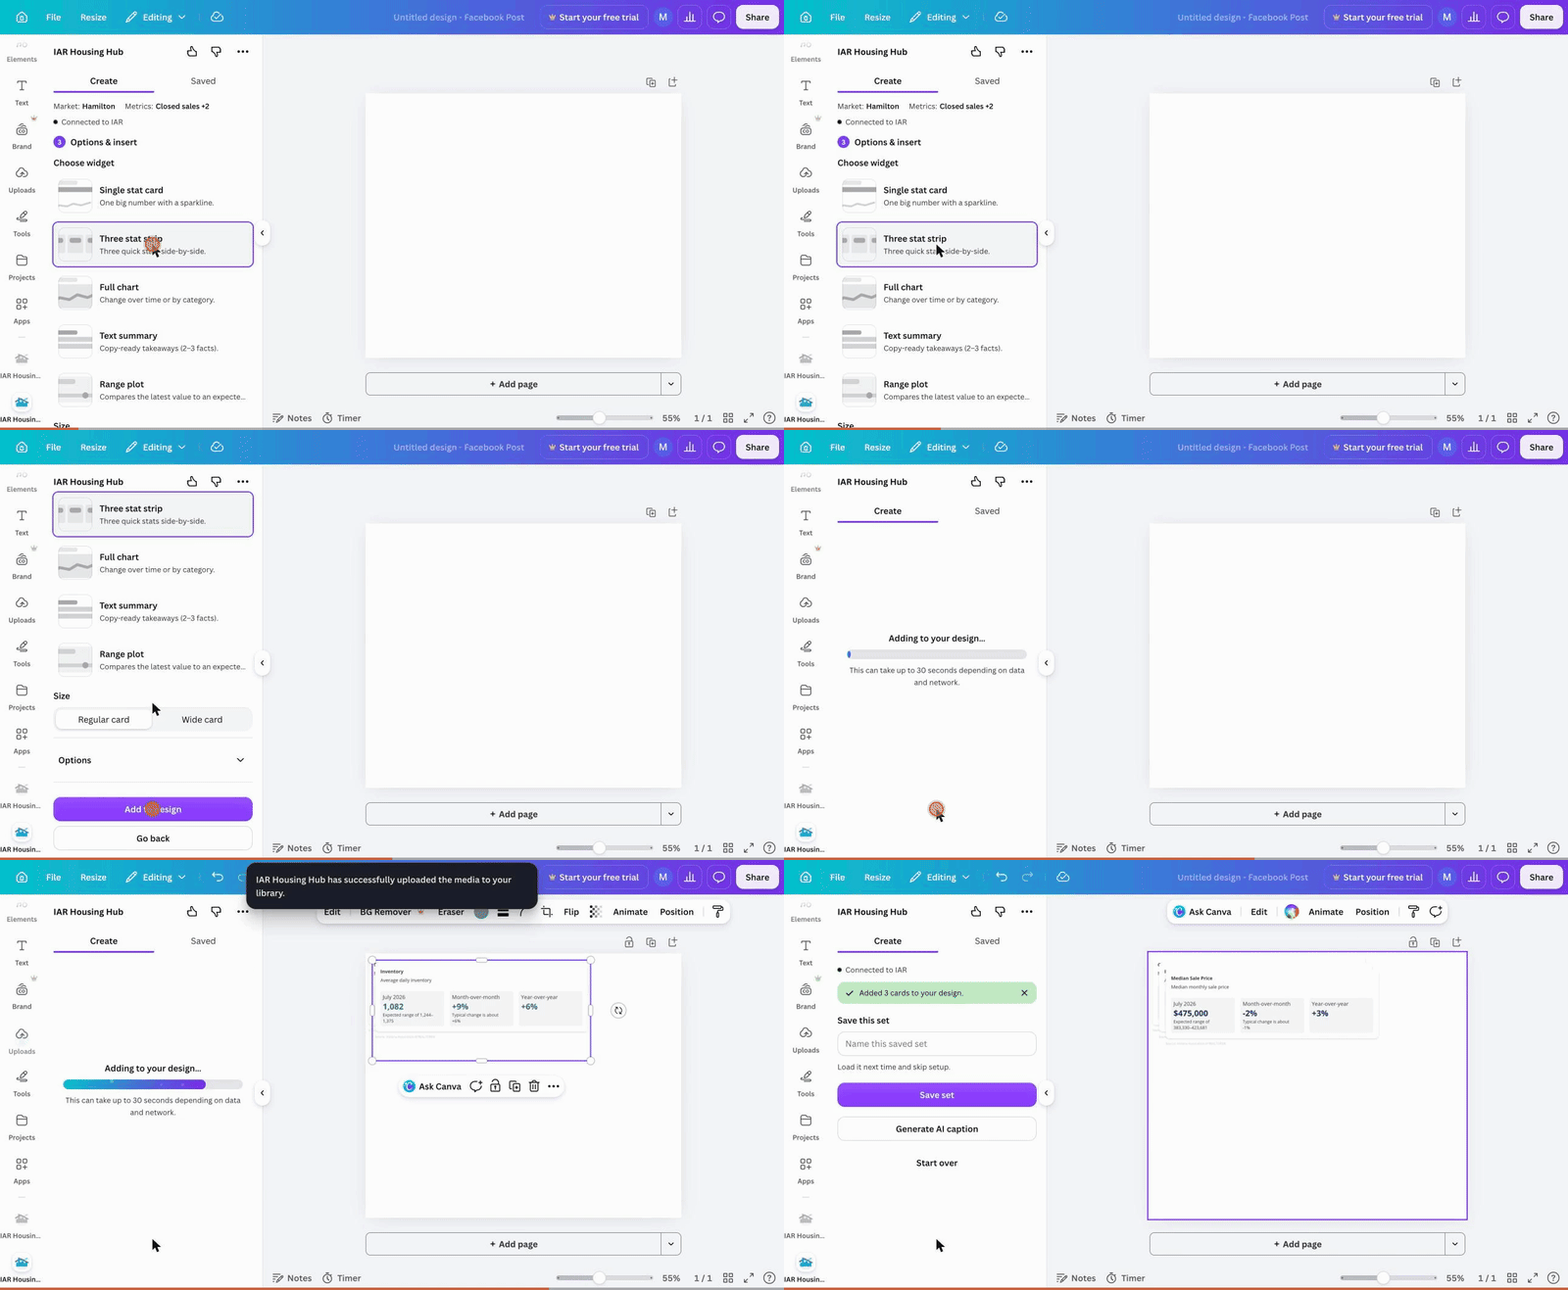
Real data, already styled, ready to post.
The numbers in your posts should be as current as your listings, but screenshotting charts and retyping stats is where updates go to die. The app drops live, IAR-sourced cards straight onto your canvas, so the design work you already do in Canva picks up credible local data for free. Your audience sees a broker who knows the market this month, not a stock graphic.
After your cards land, name the set and click Save set. Next month you load it from the Saved tab and skip the whole setup.