 Reports
Markets
Latest
Maps
Learn
Spark
Reports
Markets
Latest
Maps
Learn
Spark
A strong springtime housing market cooled over the summer with rising mortgage rates, leaving homes on the market longer — though patient sellers still capitalized on healthy appreciation (and became buyers driving activity among higher-priced homes).
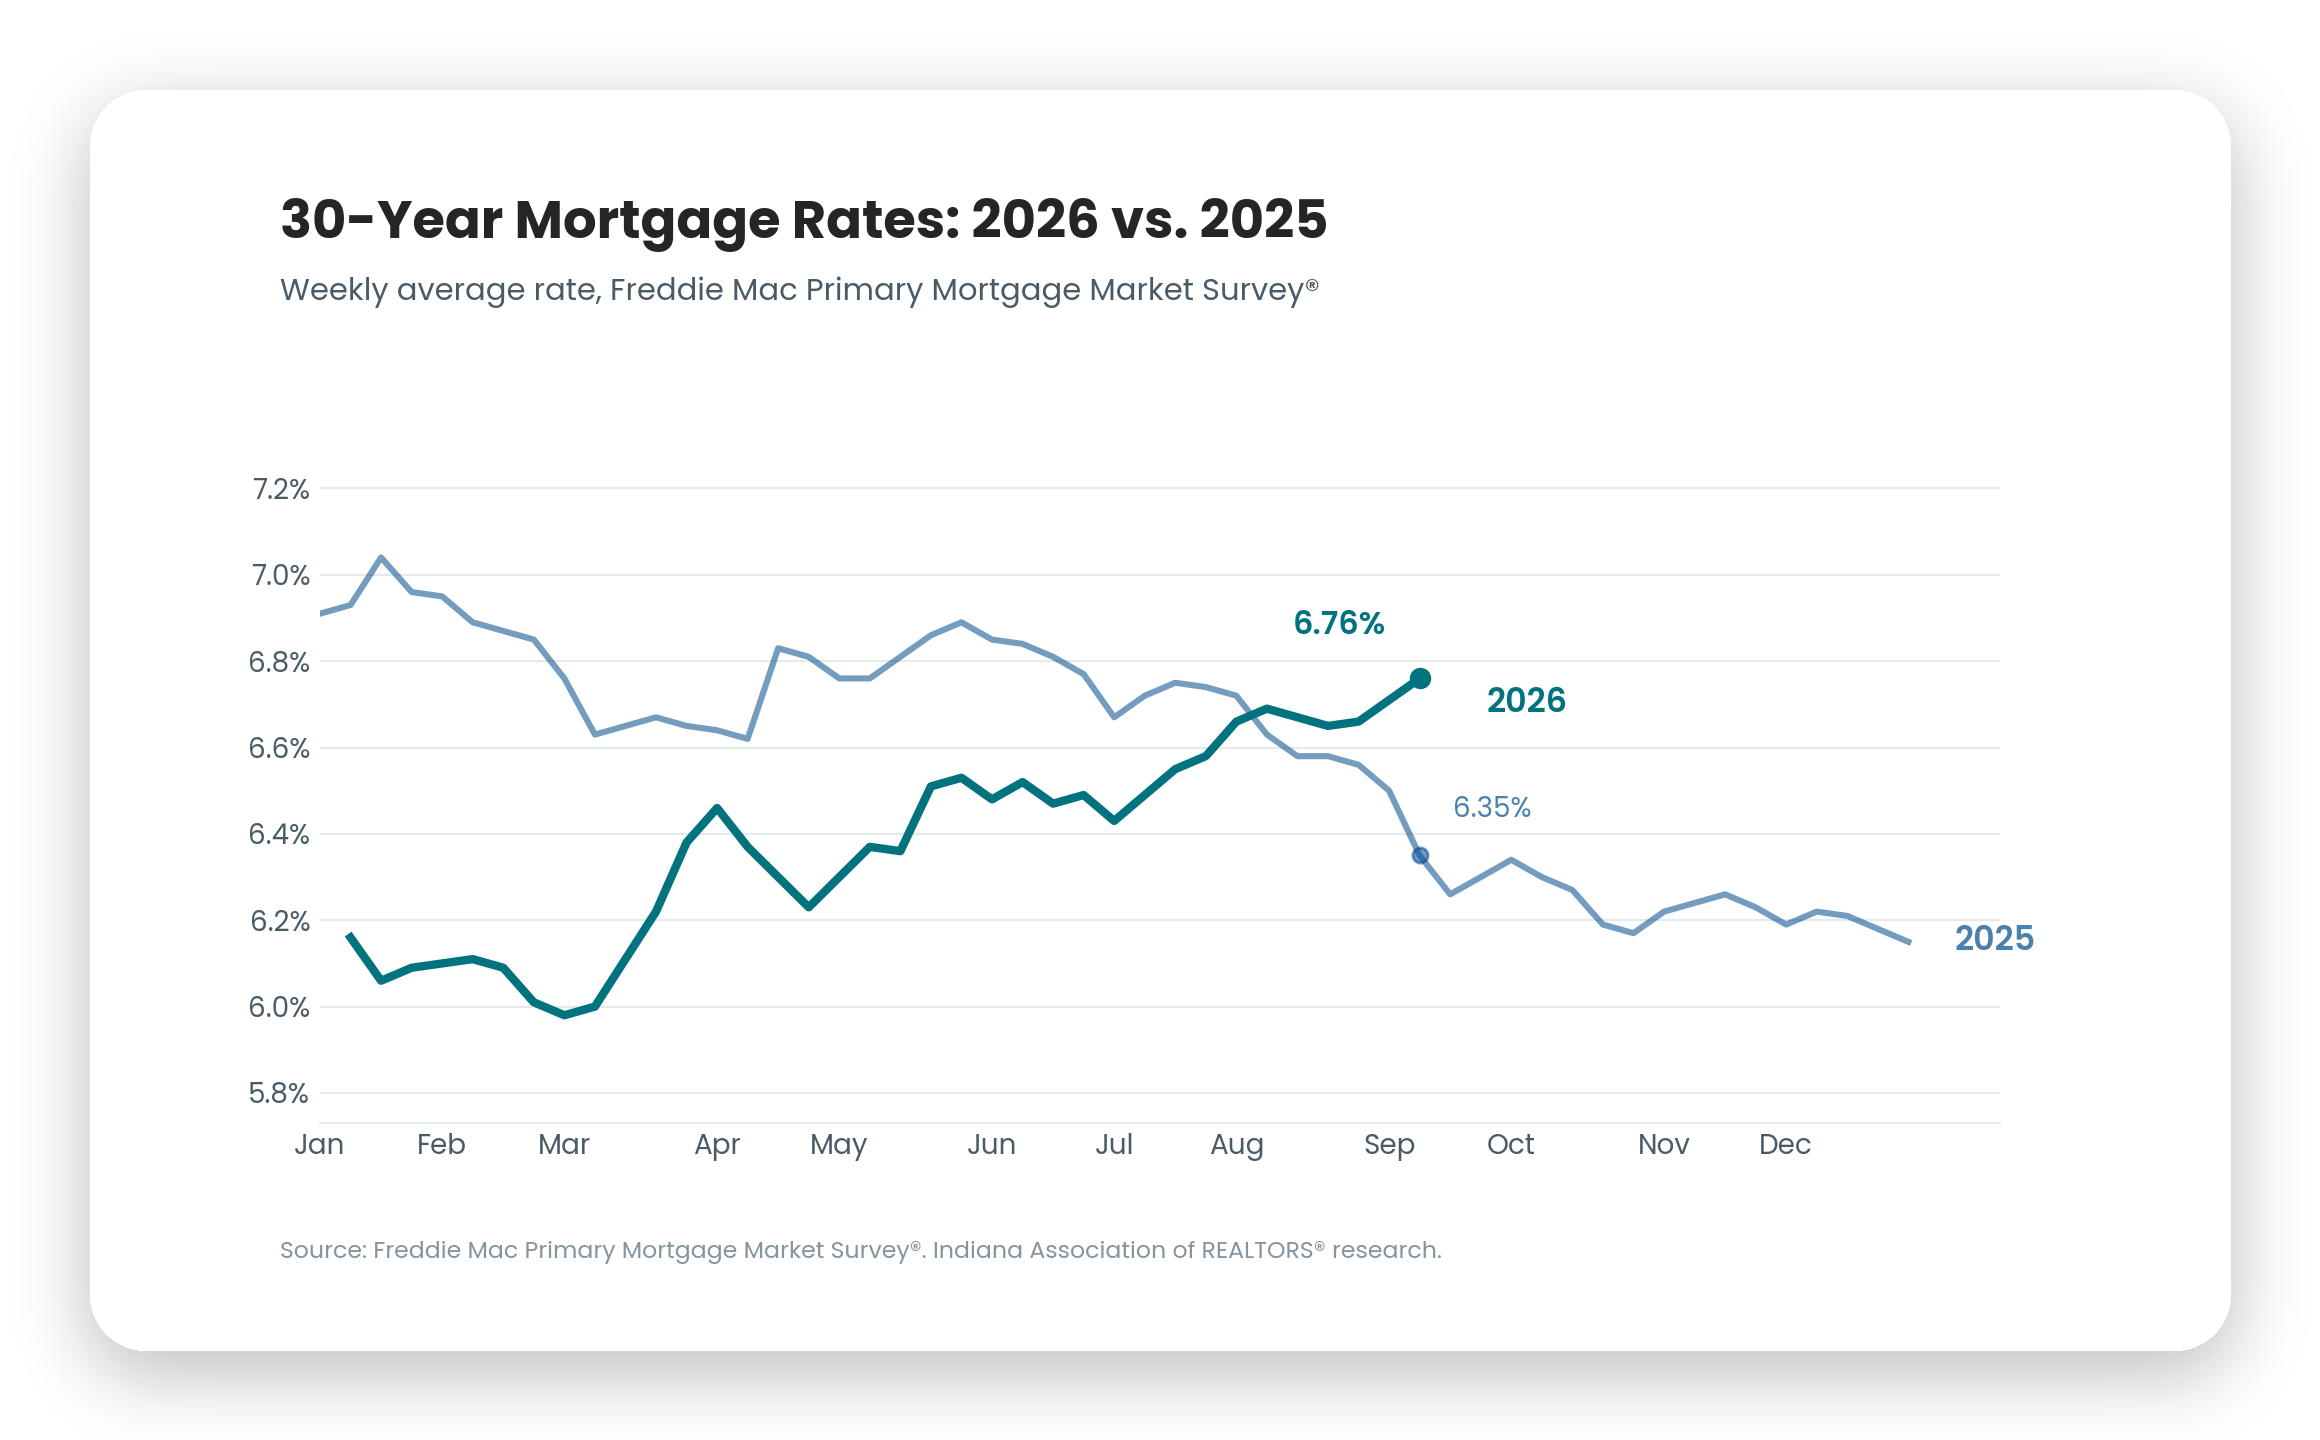
Mortgage rates started 2026 near 6% but had hit the 6.5% threshold heading into Memorial Day; rates hovered around that mark for the next two months before averaging nearly 6.7% in August — climbing above 2025 for the first time this year.
Consistent with this trend, statewide pending sales peaked in April and May before dropping about 5% each month through the summer:
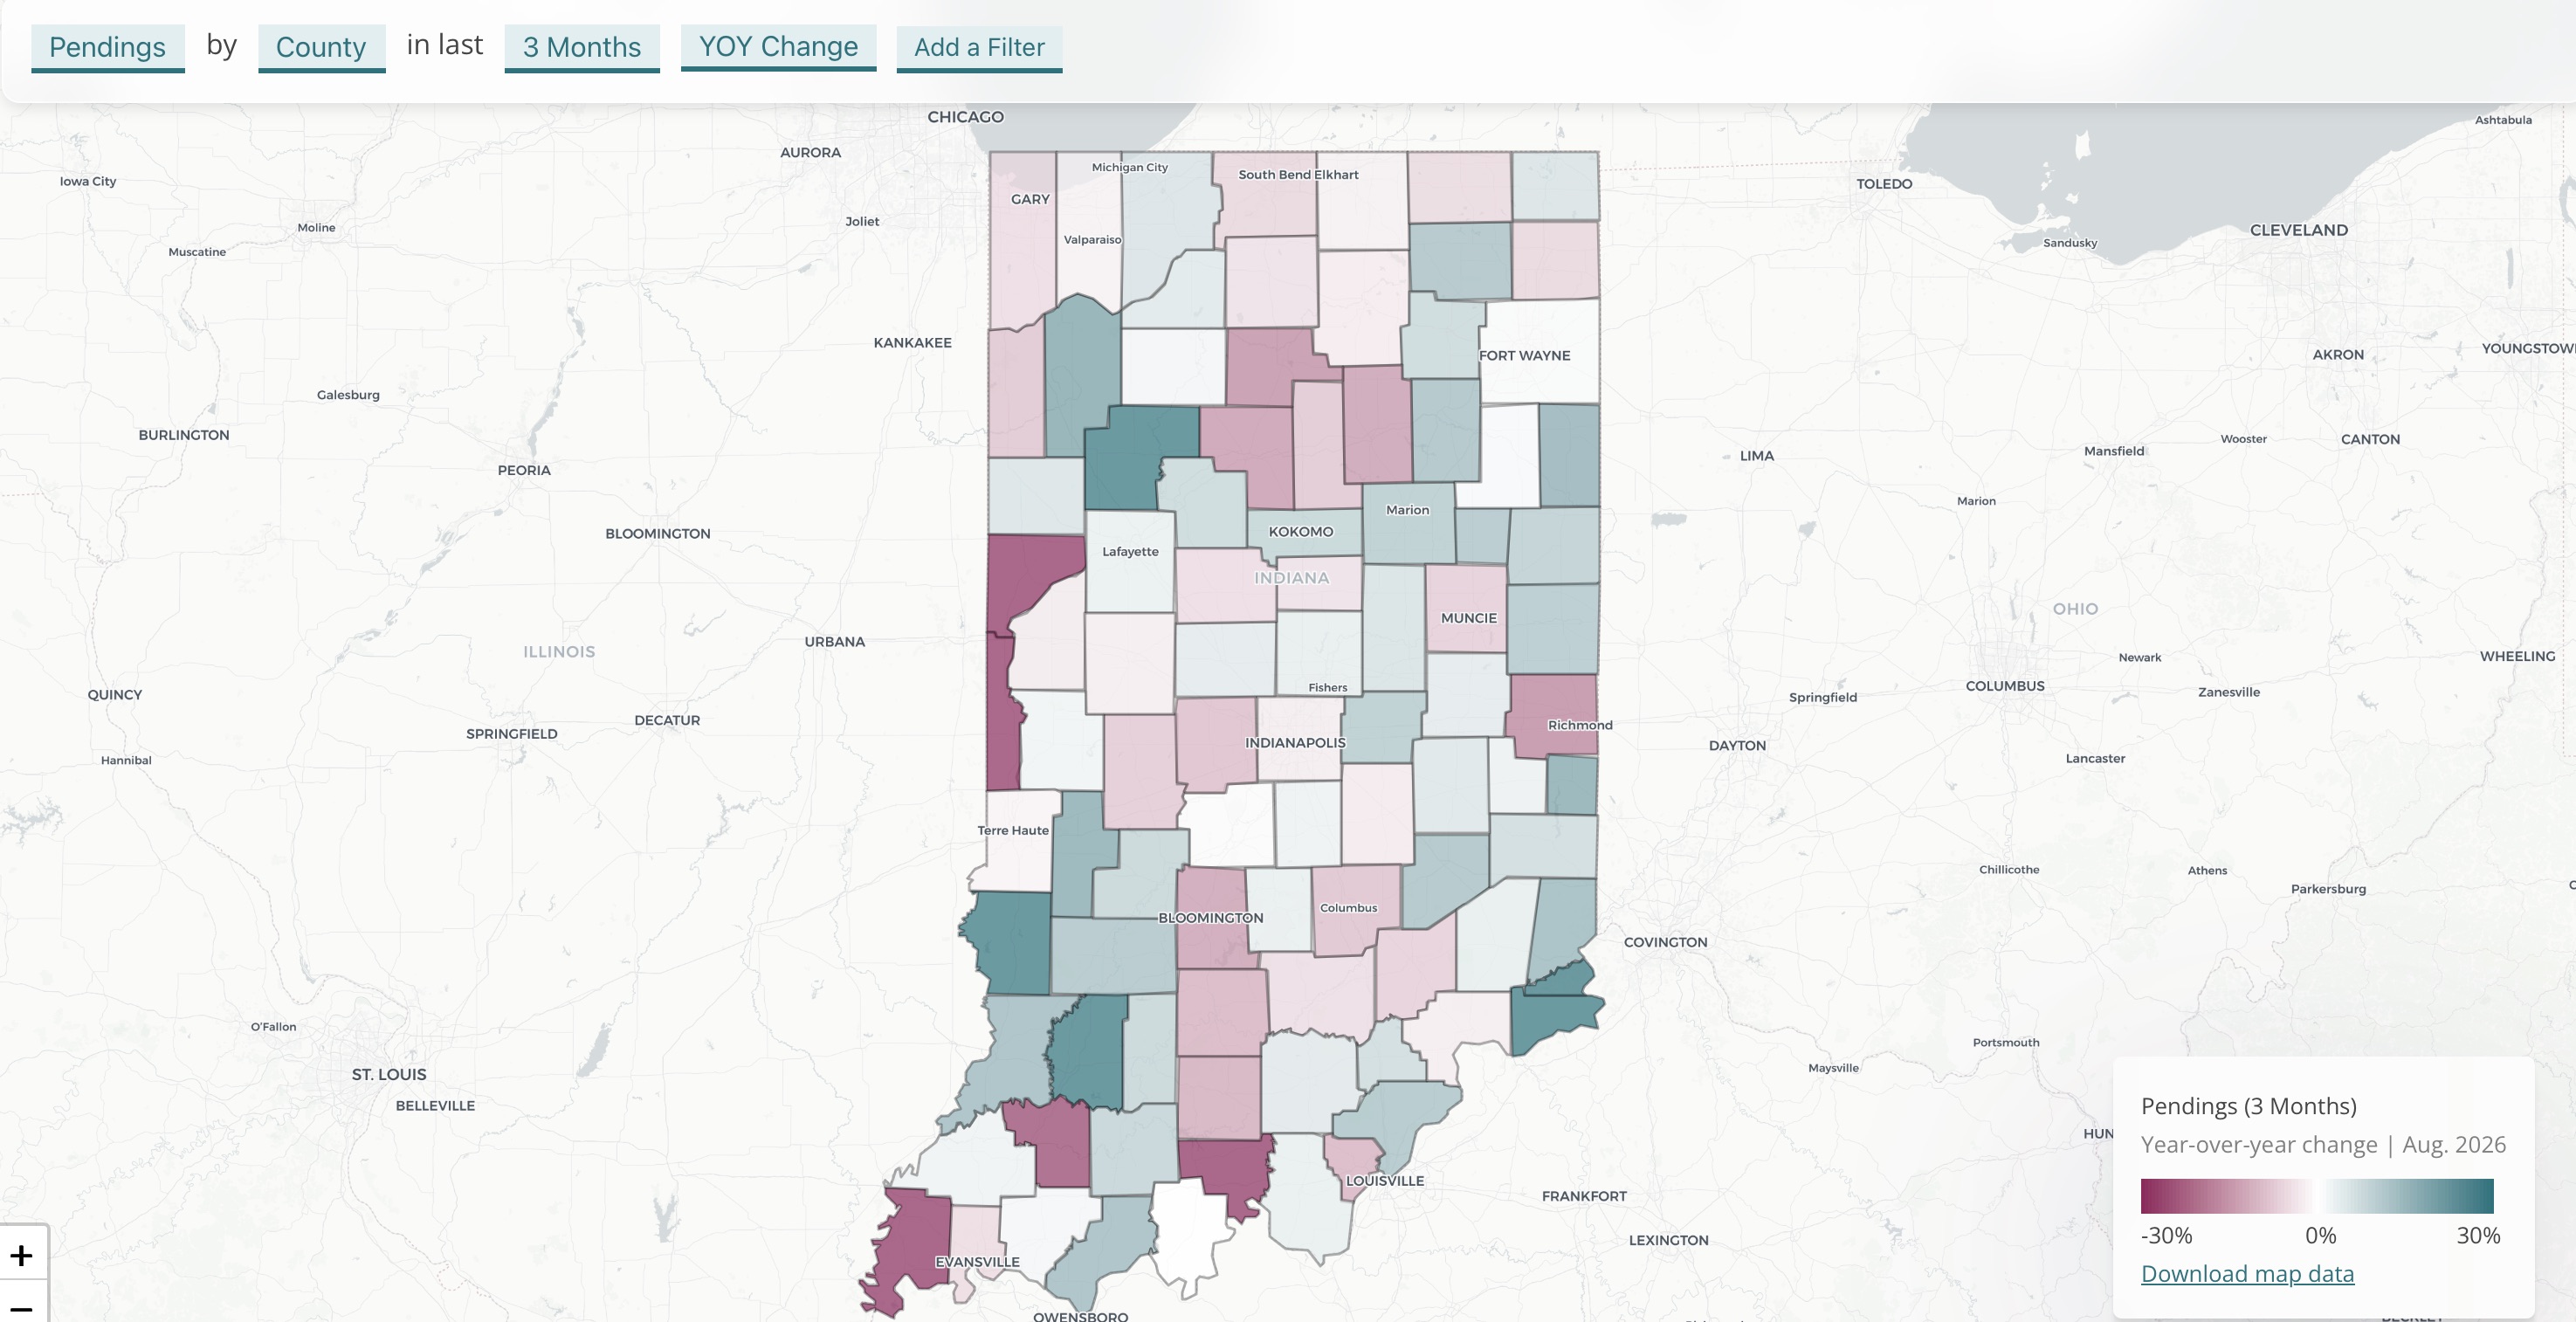
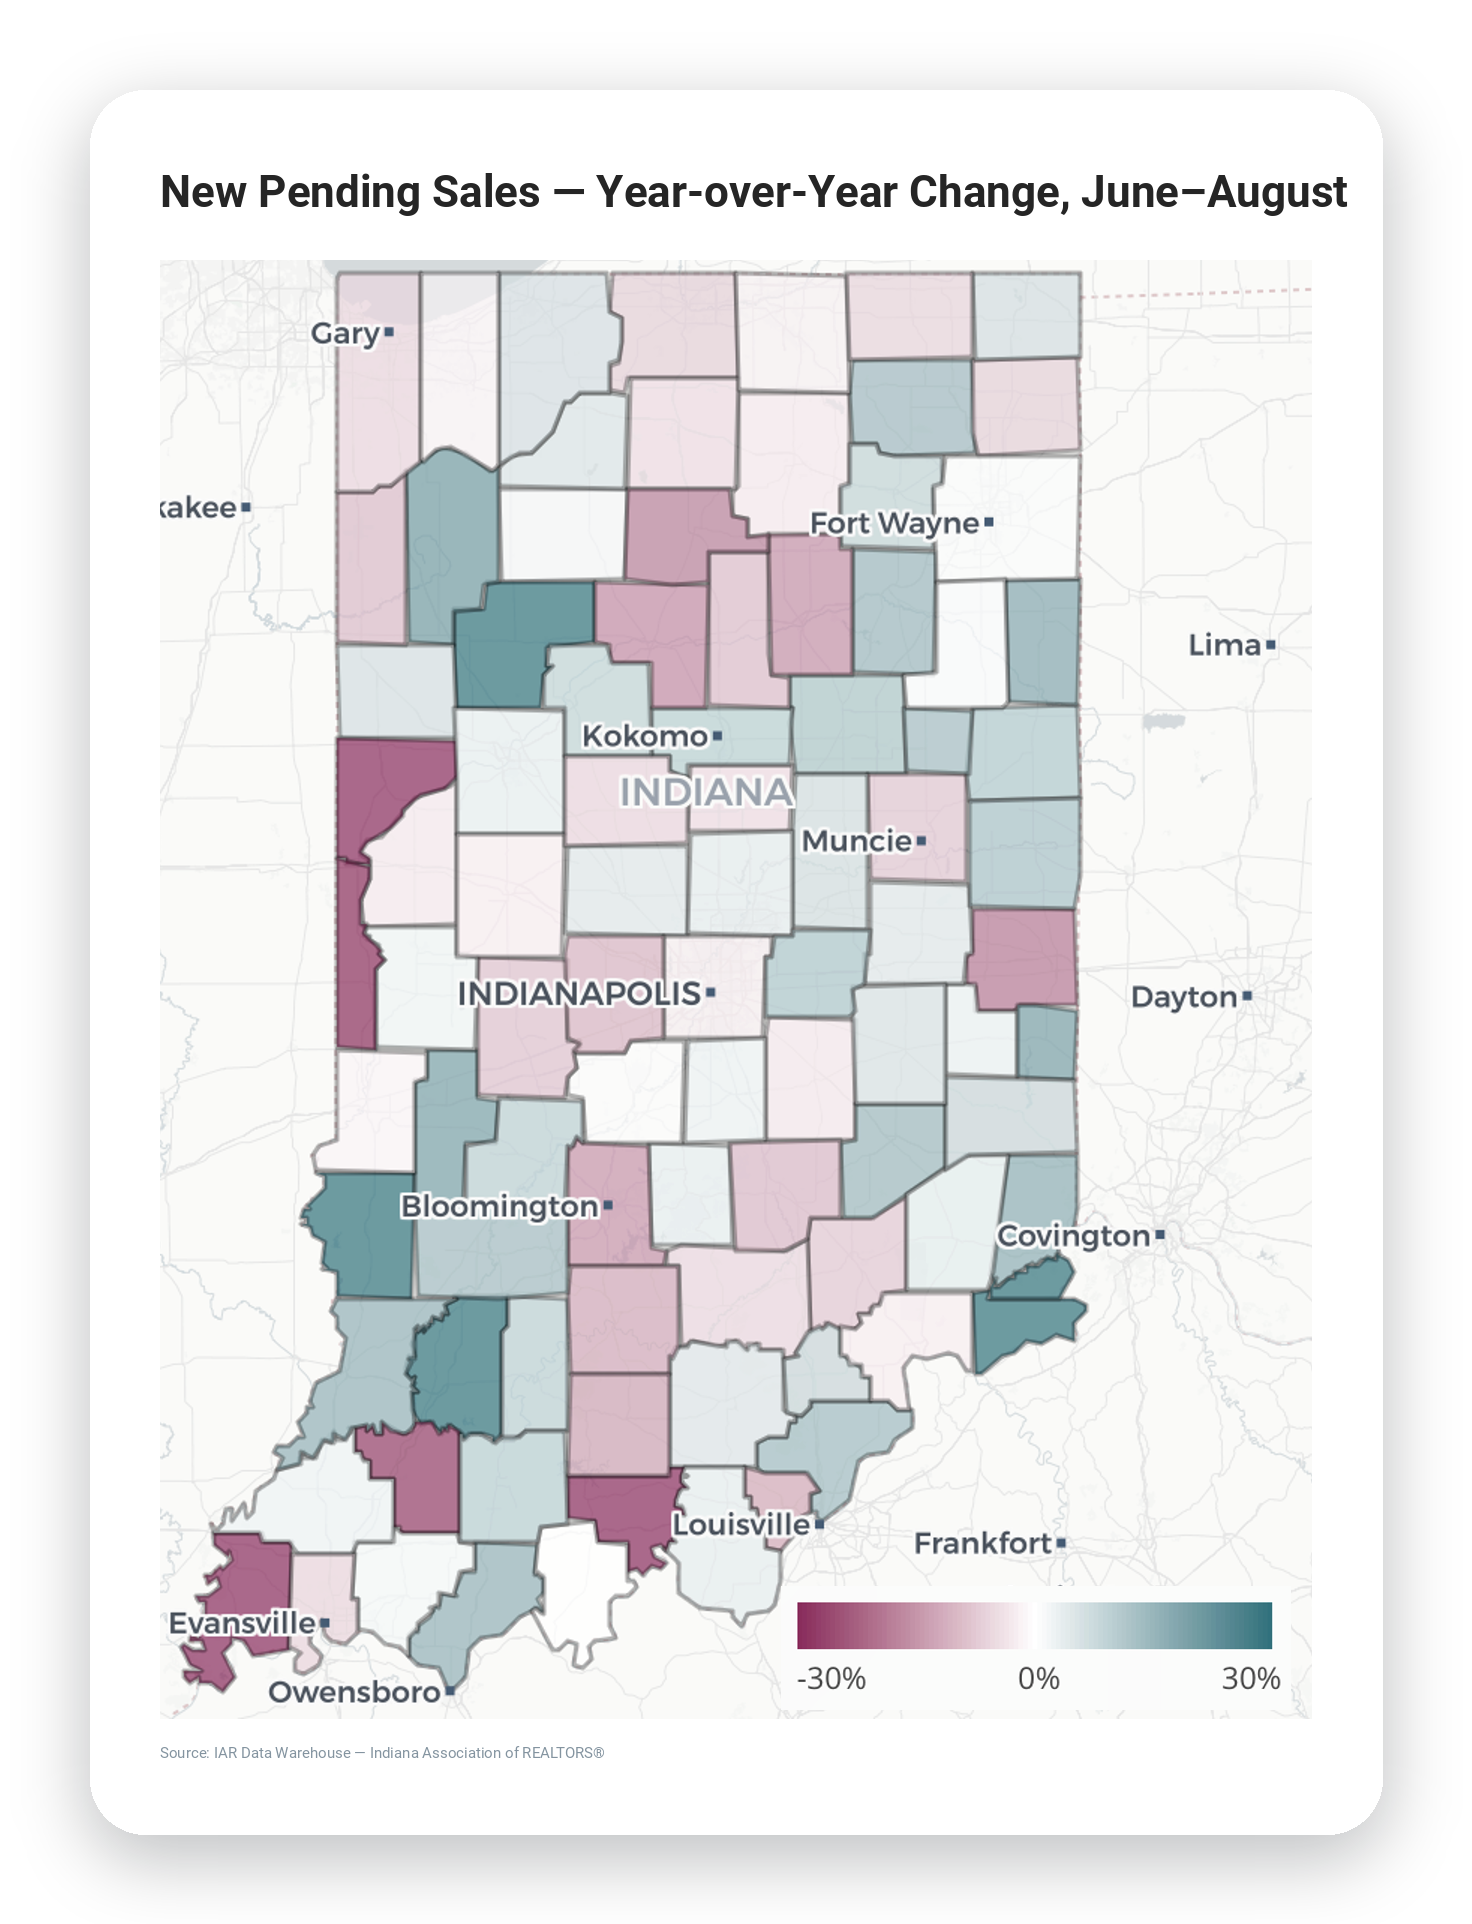
In general, new pending sales stayed positive in more suburban and rural counties as rates moved higher during the summer.
Home prices are generally lower in rural communities, which helps mitigate the effect of rising rates.
In fact, purchasing a median-priced home in a rural county over the summer (assuming the average household income, a 10% down payment and prevailing mortgage rates) is still affordable based on the 30% threshold for home payments as a percent of gross monthly income.
Surprisingly, buying a home in a suburban county is also more affordable than the statewide trend using the same measure; prices are much higher in the suburbs, but so is the median household income.
Repeat buyers are also less affected by changing mortgage rates, as they leverage the proceeds of their previous home sale into the budget of their next home and finance less of the purchase.
In suburban counties, for example, new pending sales were up 4.5% versus 2025 from June through August; the majority of pending sales over the summer months were above $350,000, and these higher-priced contracts were up 7% year-over-year.
Statewide, summer pending sales were down about 1% year-over-year; contracts below $250,000 were down 6%; pending sales above $250,000 were up 4%. Pending sales above $350,000 were also up 4% and made up a larger share of total contracts this summer (33%) versus last year (31%).
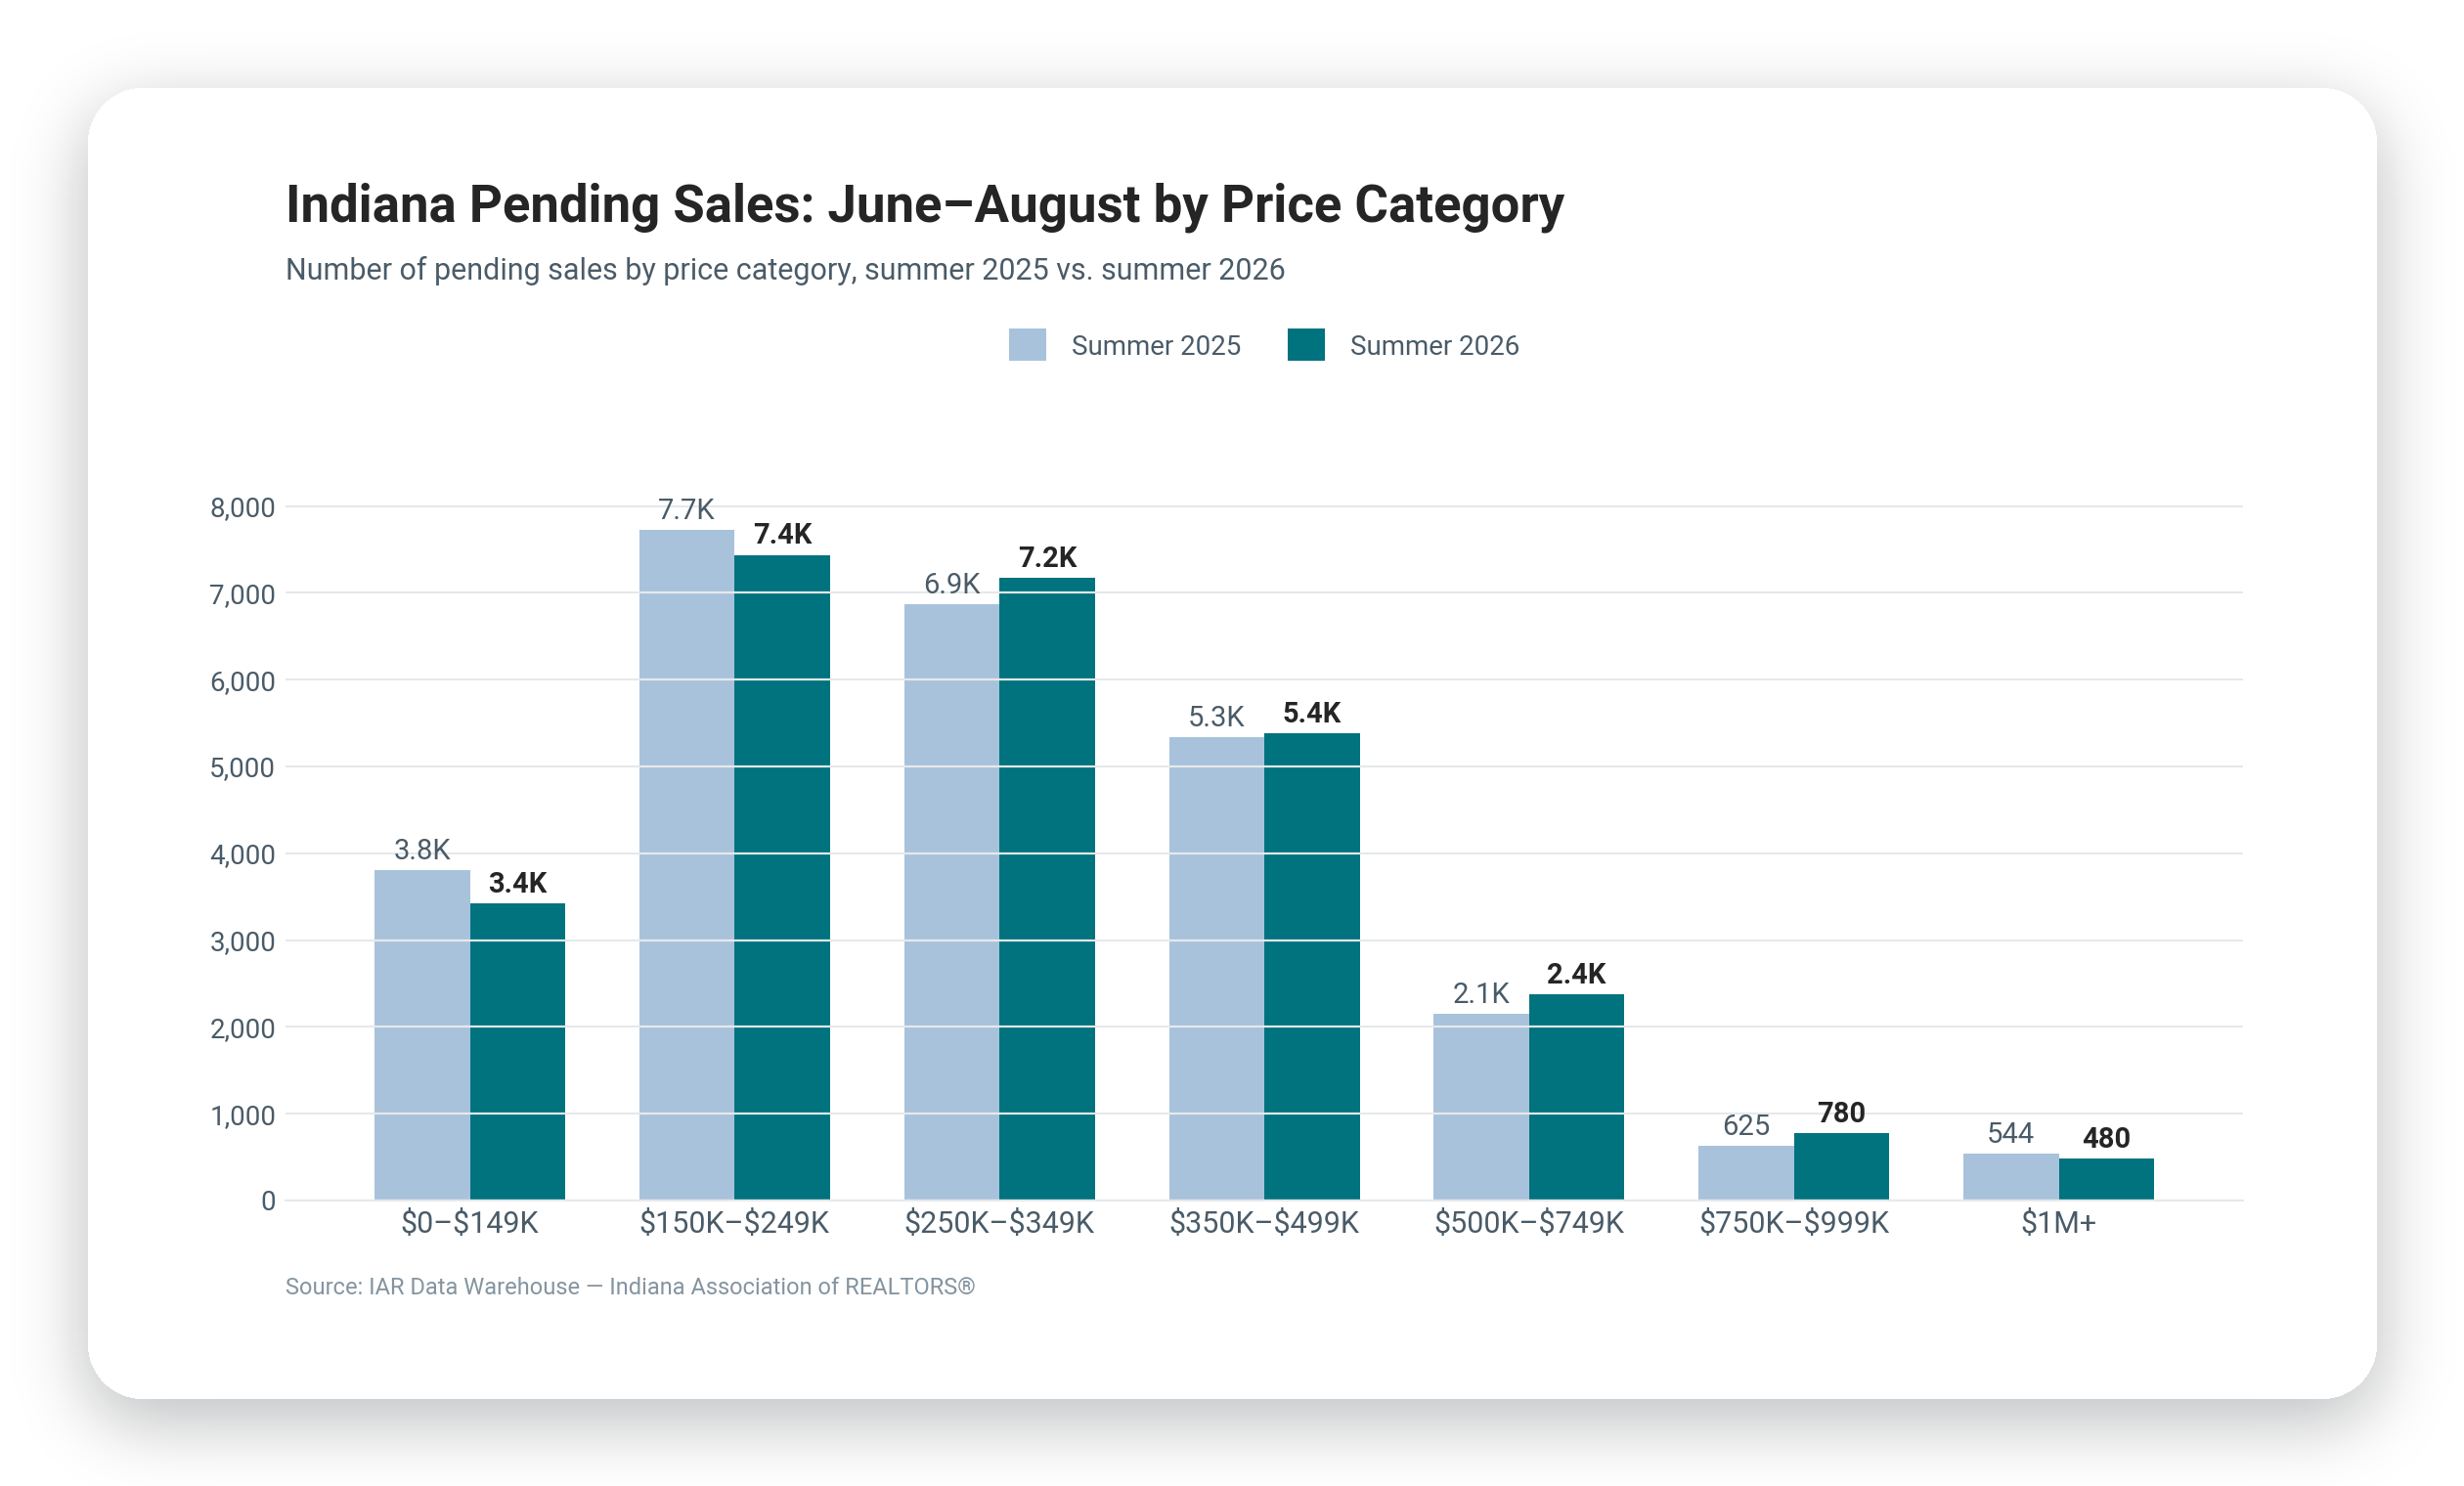
As higher rates pushed the qualifying income for a $350,000 home above $100,000, we can assume fewer first-time buyers and more equity-rich sellers-turned-buyers keeping new pending sales close to 2025 totals from June through August.
At a high level, we can say that the last three summers (2024, ’25 and ’26) have some key features in common: Mortgage rates averaging over 6.5%, statewide median price appreciation between 4-5% and inventory rising year-over-year.
Using Home Mortgage Disclosure Act (HMDA) data from 2024 and 2025, we decided to make a few assumptions about repeat homebuyers by county and see what we can learn about this summer.
We used a very conservative approach to determining who is likely to be a repeat buyer (existing homeowners buying their next home): Mortgage applicants older than 34 financing less than 75% of their home’s purchase price (suggesting the use of sale equity) for a primary residence. This is consistent with NAR’s 2025 Profile of Home Buyers and Sellers, which shows repeat buyers financing an average of 77% of their home purchases.
Under this methodology, this map shows county-level shares of the most likely repeat buyers in 2024 and 2025:
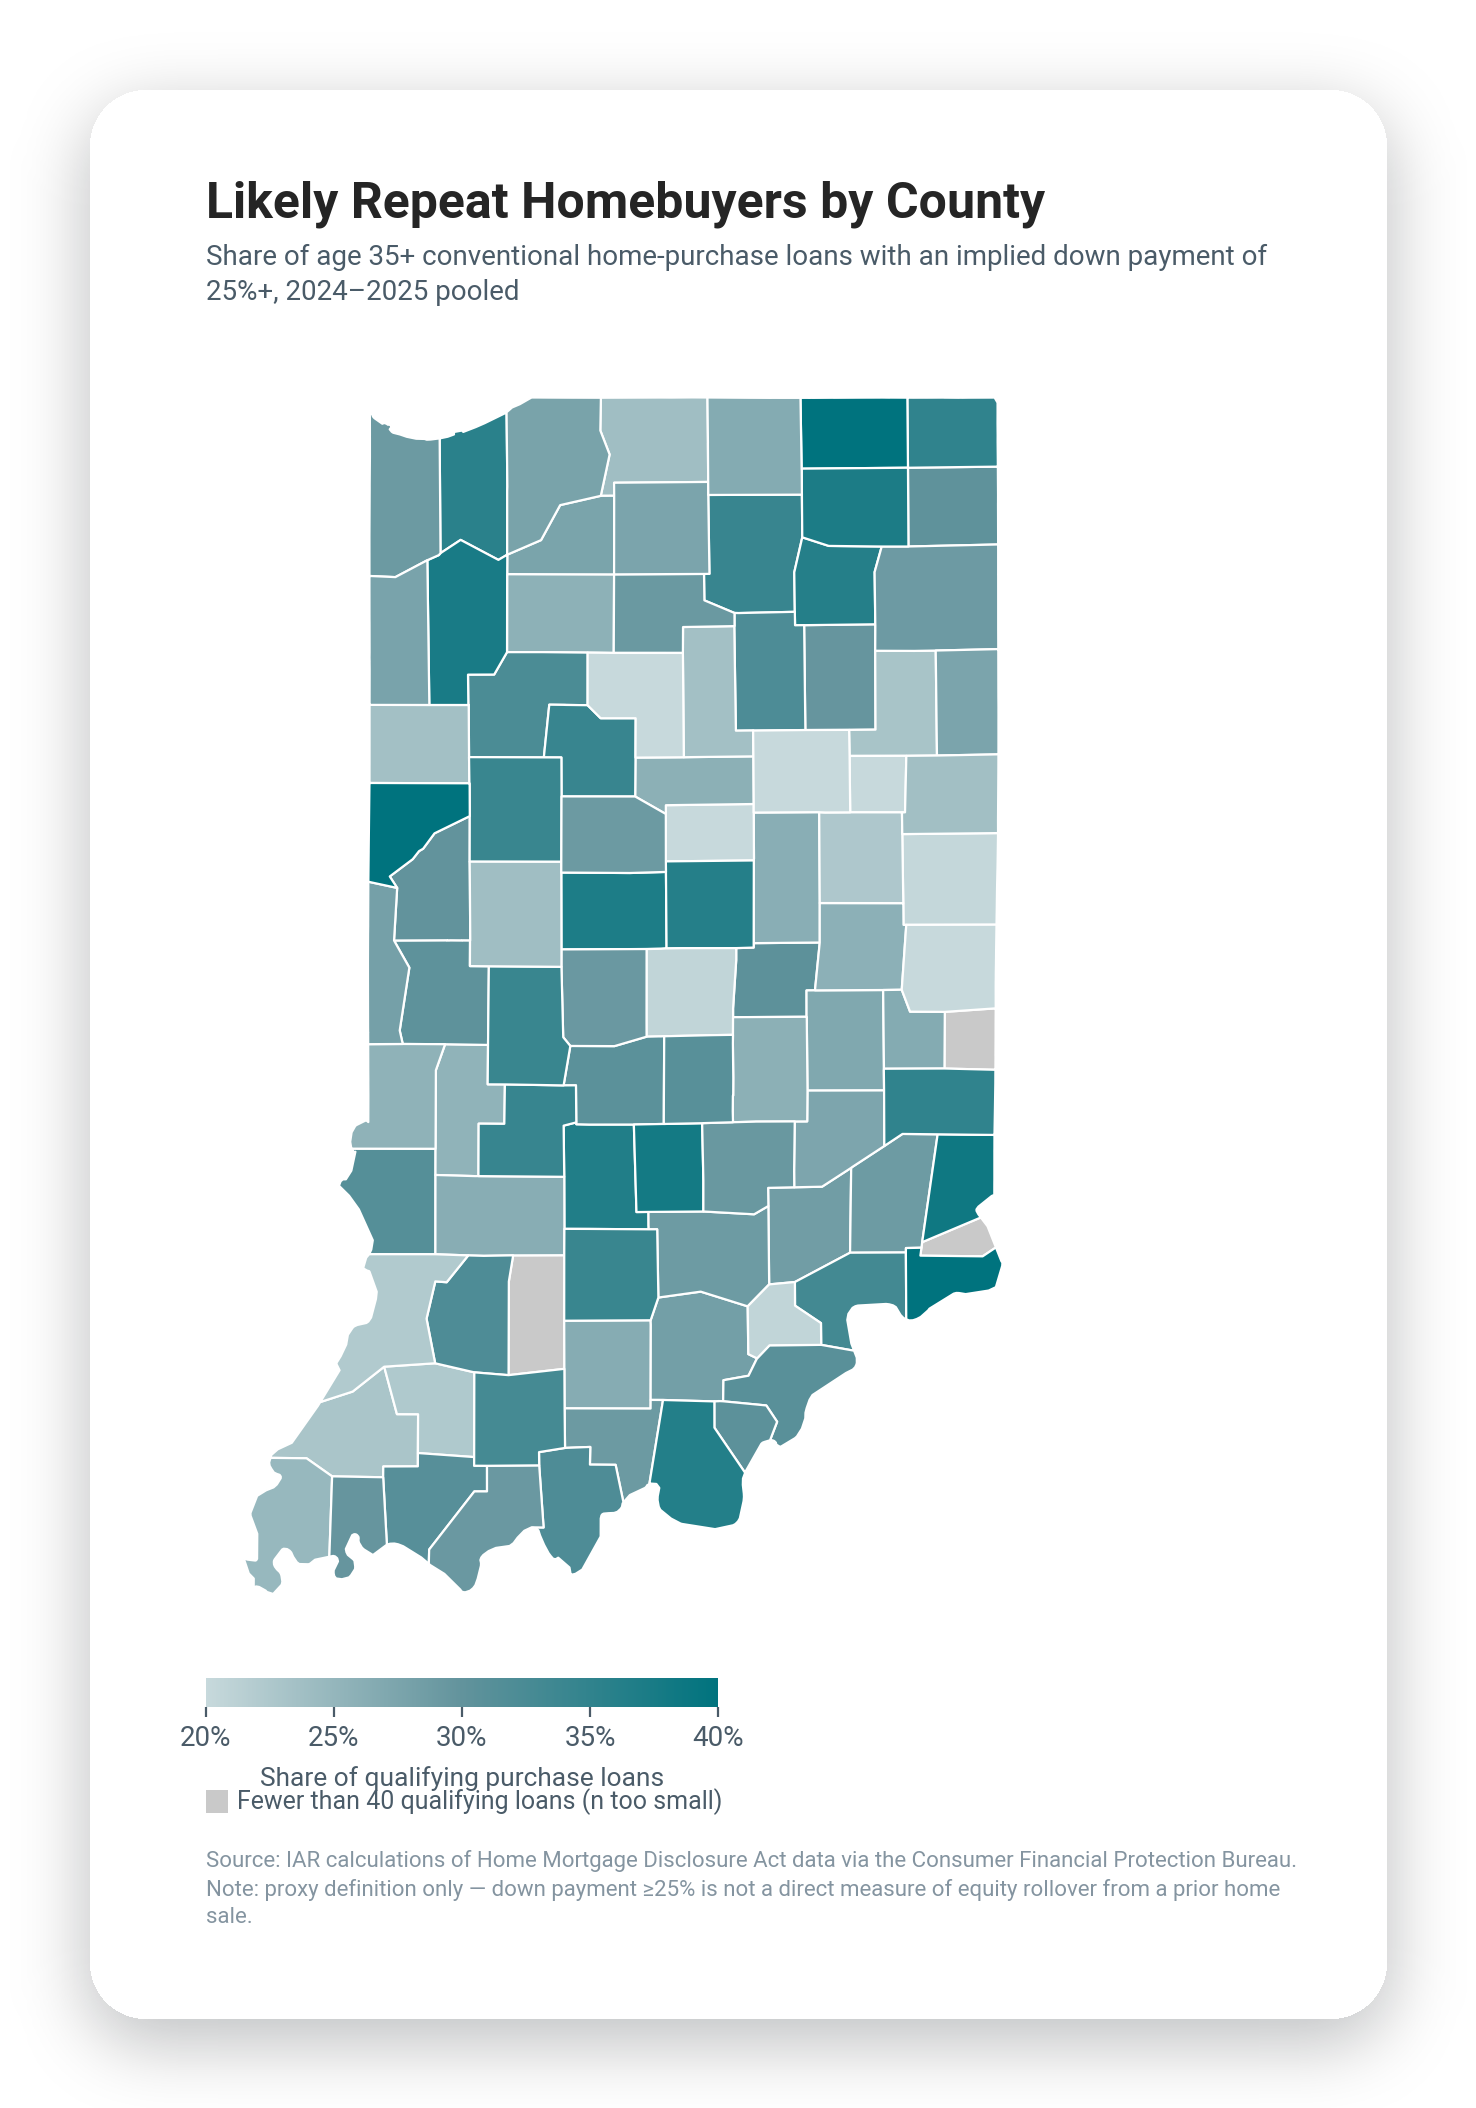
The thirty counties with the highest share of likely repeat buyers in 2024-2025 also showed a clearly more positive year-over-year trend in new pending sales:
This means the one-two punch of higher rates and prices again narrowed the pool of potential buyers in summer 2026 – and it was homeowners cashing in on historic levels of equity who were most willing and able to dive in, driving the action in many of the same local markets as the past two years (counties that tend to have higher homeownership rates, as you would expect).
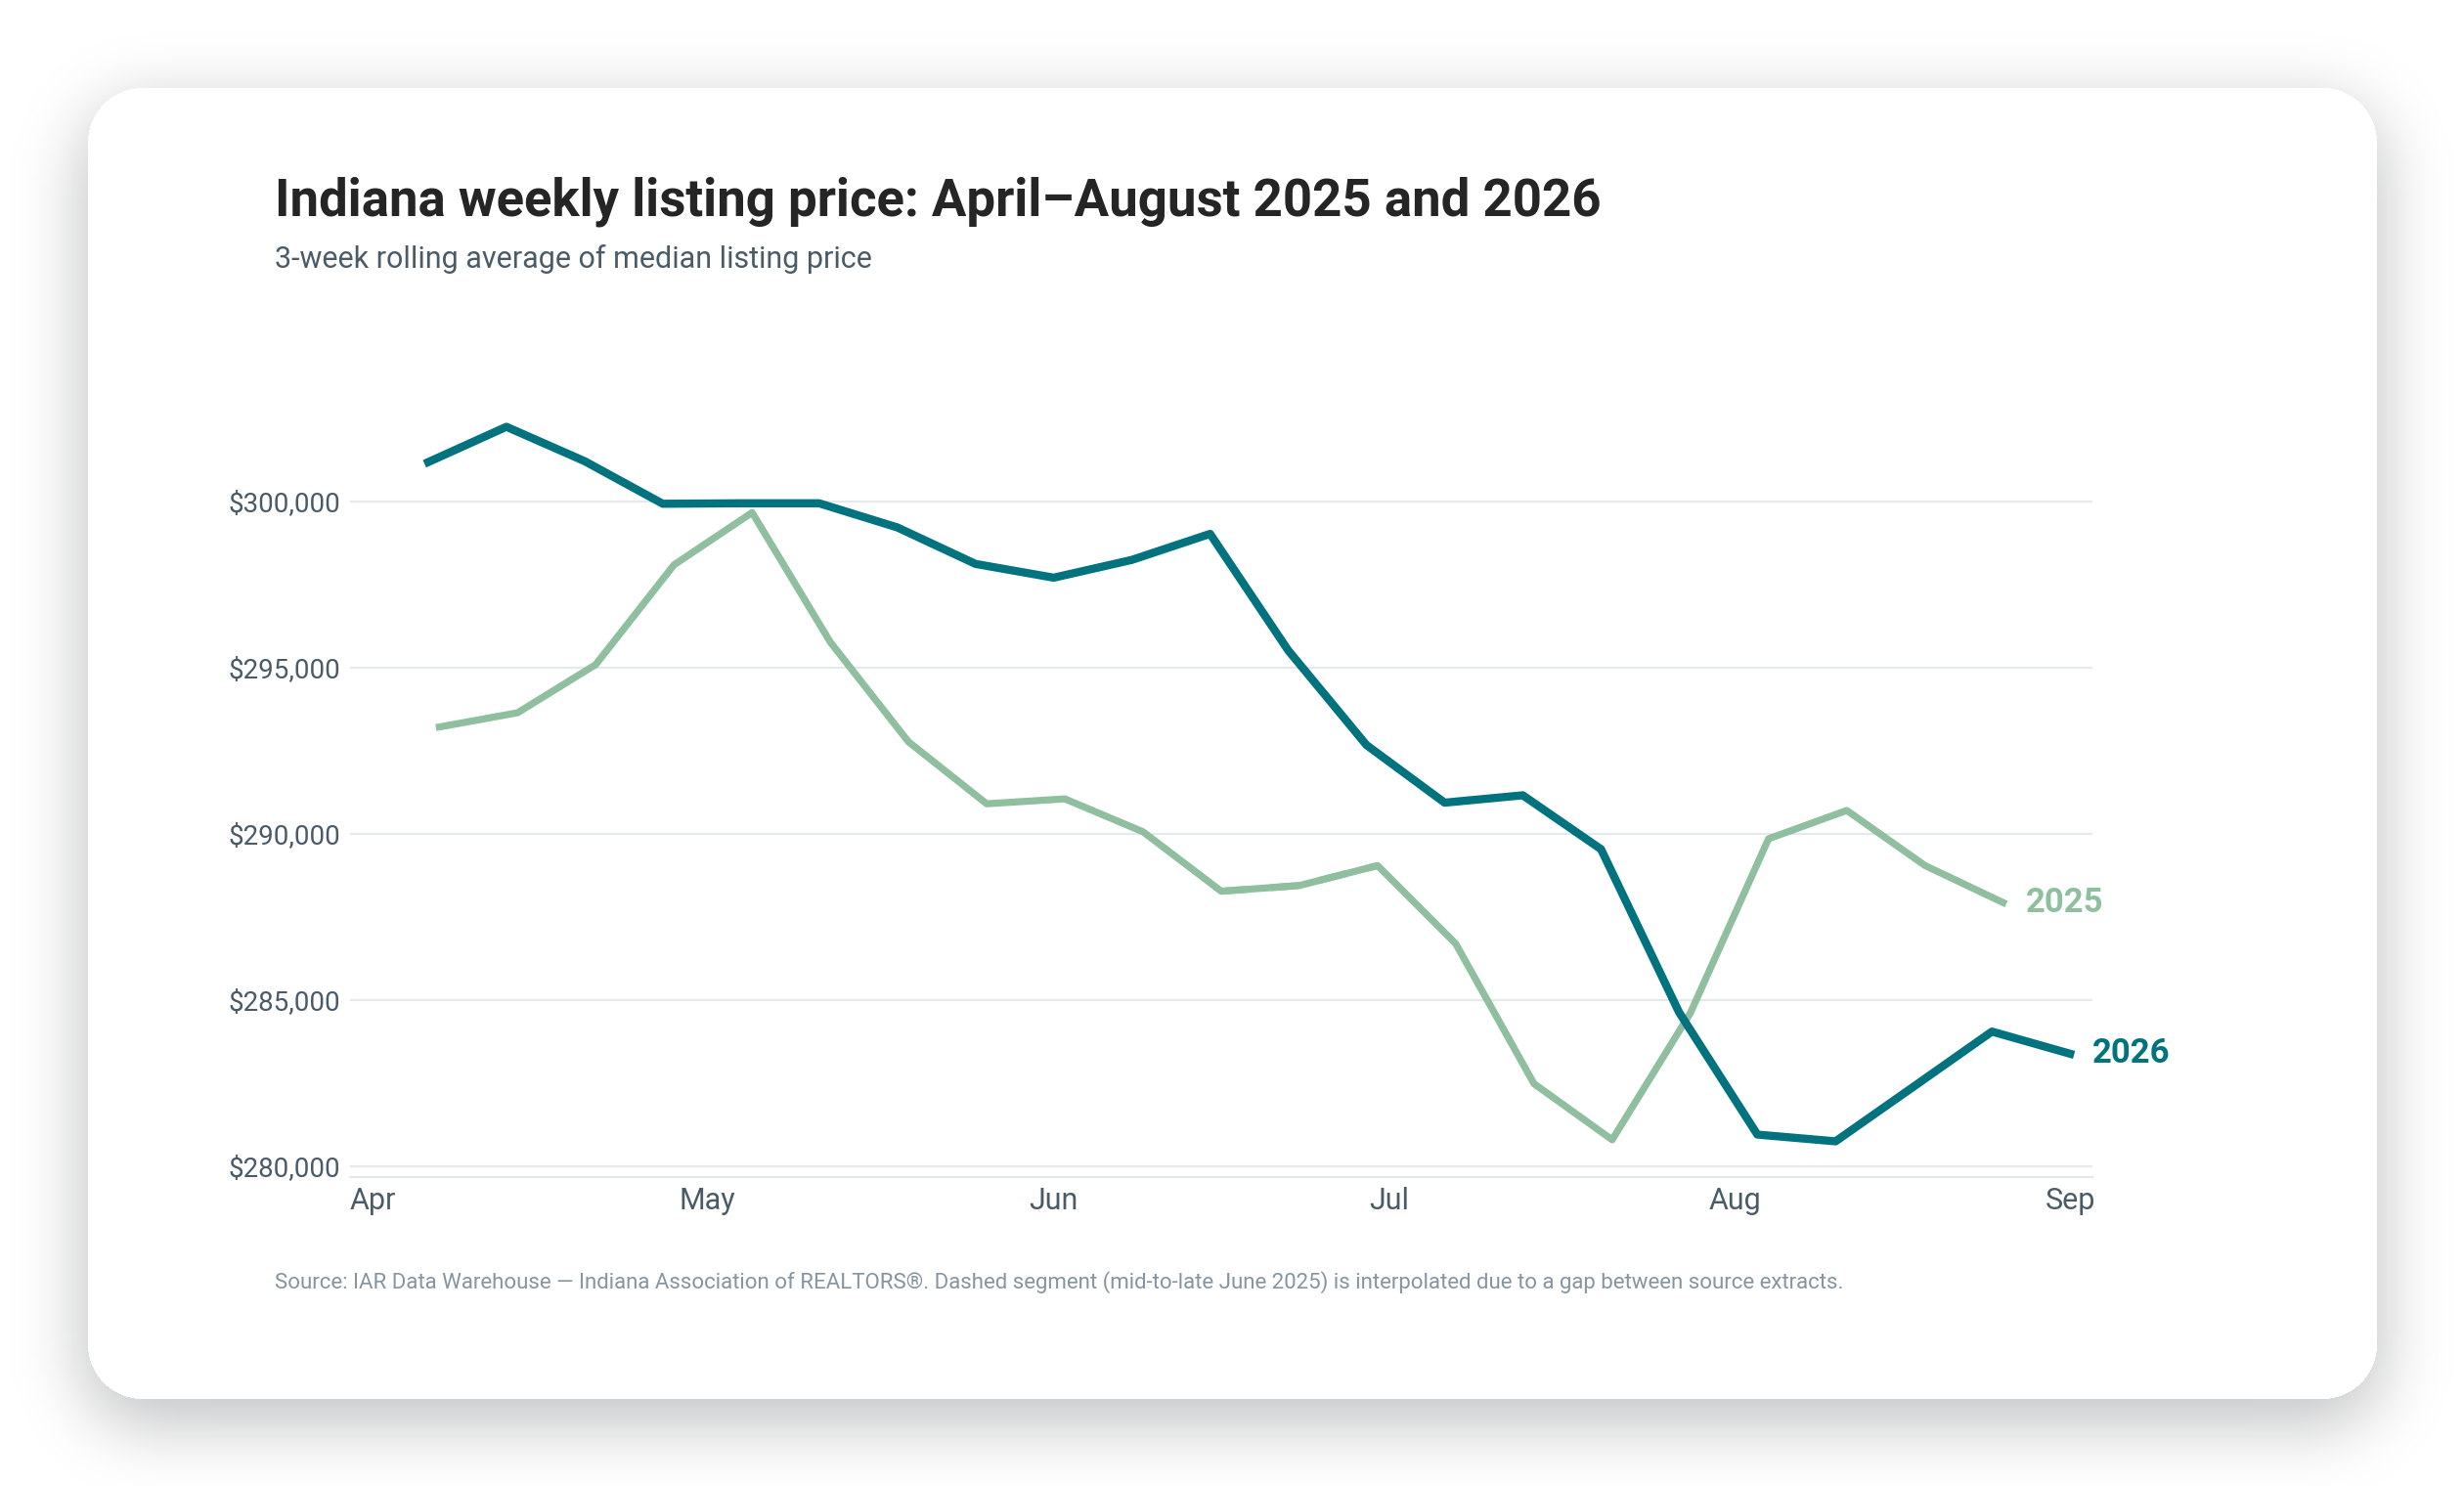
Homes took a couple of additional days to go under contract, and some sellers may have settled for a more conservative asking price.
But the ultimate benefit for sellers was clear in the bottom line – 2026 marks Indiana’s thirteenth consecutive year of real price appreciation as calculated by more than a half-million repeat sales over the last twenty years of MLS data.
Real price appreciation maintained a solid 5.9% annualized rate through the summer months (nearly double the current rate of price-per-square foot growth among existing homes). (Get updated real price appreciation rates for your city here.)
Recent analysis also shows that the cohort of sellers listing after 4-6 years in their current home has reclaimed the lead in tenure trends (moving ahead of those selling after 7-10 years).
A homeowner who bought a median-priced home in Summer 2020 ($189,000) would have seen its value rise to more than $266,000 using state median real appreciation rates – bringing six figure potential equity to a decision to move.
Using the last three years as a barometer, there are still more than 30,000 new listings that will come to market between now and the end of 2026: Listing brokers have a compelling case for sellers who are willing to price in line with market.
If the current climate holds, the most reliable pipeline for buyer clients will be seller clients as repeat buyers continue to be more active.
The same Home Mortgage Disclosure Act (HMDA) data referenced above tells us that loan applications by Indiana buyers under 35 made up 42% of total purchase applications in 2025, up slightly from 2019. Even the share of applicants under 25 increased with more loan co-signers and higher down payments suggesting assistance from family.
As buyers gain seasonal leverage closer to the end of the year, there could be opportunities for younger buyers willing to make the leap with inventory at 2019 levels as we moved into September.
This interactive map summarizes year-over-year pending sales by county for the summer months. Click the map to open it, change the time period, or download the county data.