 Reports
Markets
Latest
Maps
Learn
Spark
Reports
Markets
Latest
Maps
Learn
Spark
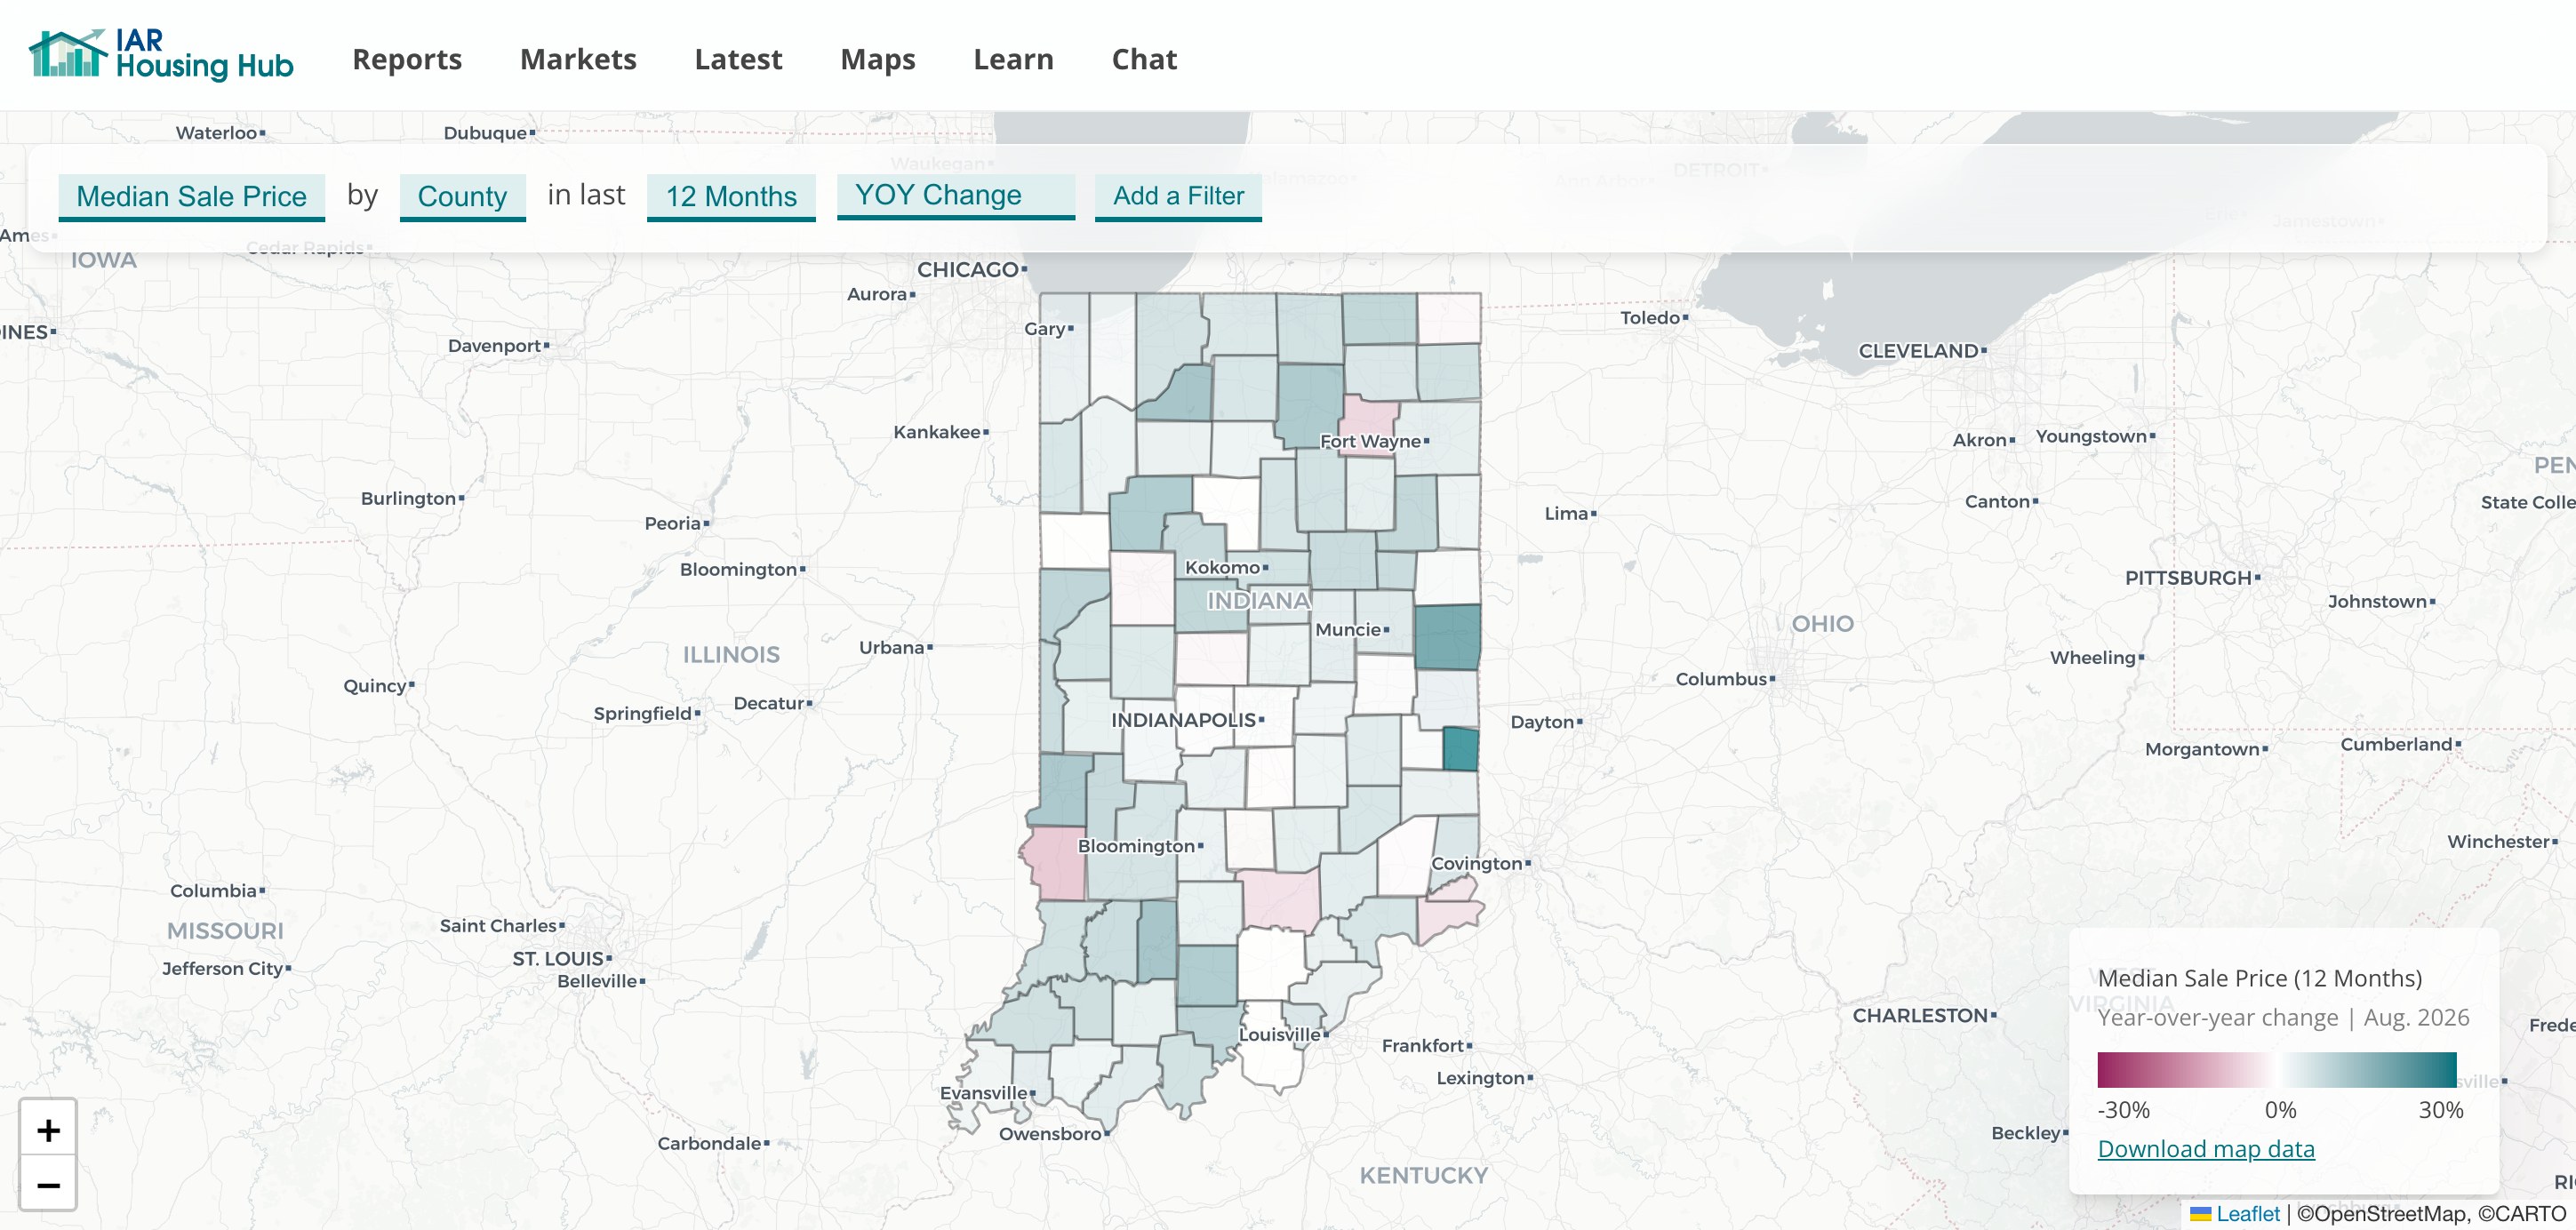
We compared the median sale price in each Indiana county for the 12 months ending in August 2026 with the 12 months before. Prices rose in 77 of 92 counties, but not evenly. In the 23 counties where homes cost the least a year ago (a median of $180,000 or less), the typical increase was 8.6 percent. In the 23 most expensive counties ($258,000 or more), it was 2.7 percent. Twelve counties saw prices fall, and eight of them are in the most expensive group.
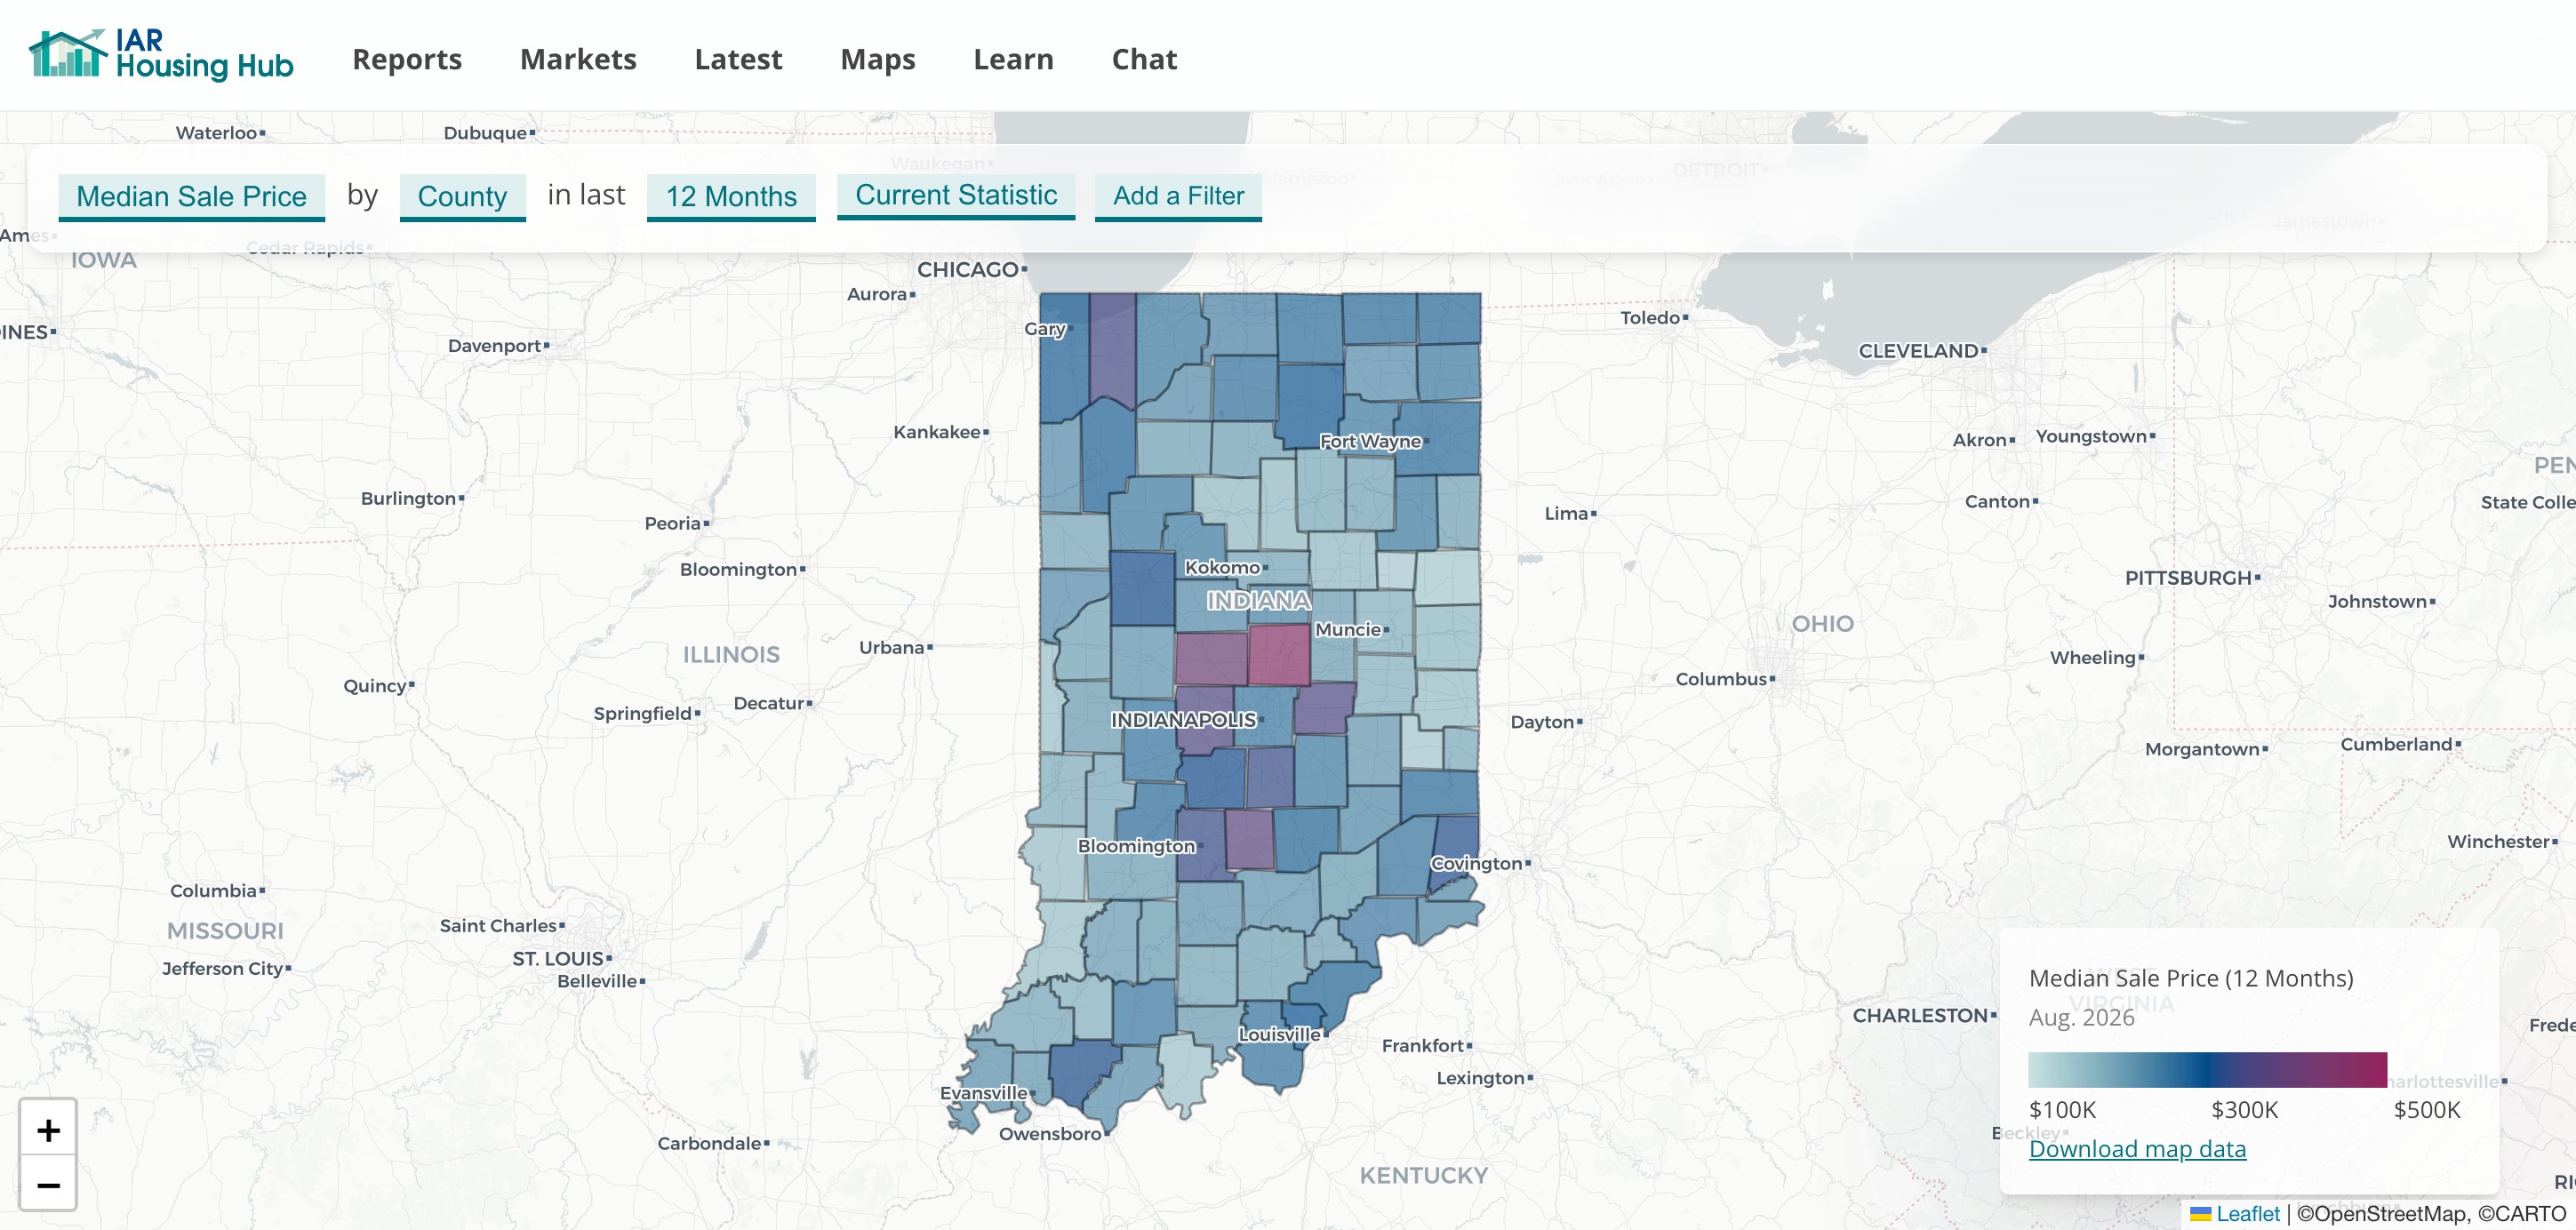
Median sale price by county, 12 months ending August 2026. The first map shows the change from a year earlier.
Most are small or mid-sized markets with low prices. The median rose 15.6 percent in Vigo County, to $185,000. It rose 10.3 percent in Grant County, to $165,500, and 8.3 percent in Howard County, to $195,000.
The counties where prices fell are mostly expensive ones, including Boone (down 1.5 percent), Tippecanoe (down 1.3 percent), and Steuben (down 1.1 percent). (County medians reflect which homes sold as well as what they sold for, so a small county can swing on a change in the mix of sales.)
In three of the five largest metro areas, yes. The more expensive counties are rising more slowly than the cheaper ones next door.
In the Indianapolis area, the median was nearly unchanged in Marion County (up 0.4 percent), Hendricks County (up 0.6 percent), and Johnson County (down 0.1 percent), and it fell in Boone. Hamilton County, the most expensive county in the state at $458,000, rose 3.3 percent. Madison County, where the median is $205,000, rose 4.9 percent.
In northwest Indiana, the increase was 1.5 percent in Porter County ($339,995), 3.7 percent in Lake County ($280,000), and 7.8 percent in LaPorte County ($249,990). In the Evansville area, it was 2.7 percent in Warrick County ($307,000) and 4.8 percent in Vanderburgh County ($214,900).
The other two metro areas do not sort this way. In the South Bend and Elkhart area, prices rose quickly in both counties: 6.7 percent in St. Joseph and 8.6 percent in Elkhart, the more expensive of the two. In the Fort Wayne area, Allen County rose 4.7 percent while its neighbors ranged from a 7.4 percent decline in Whitley to an 11.1 percent increase in Wells.
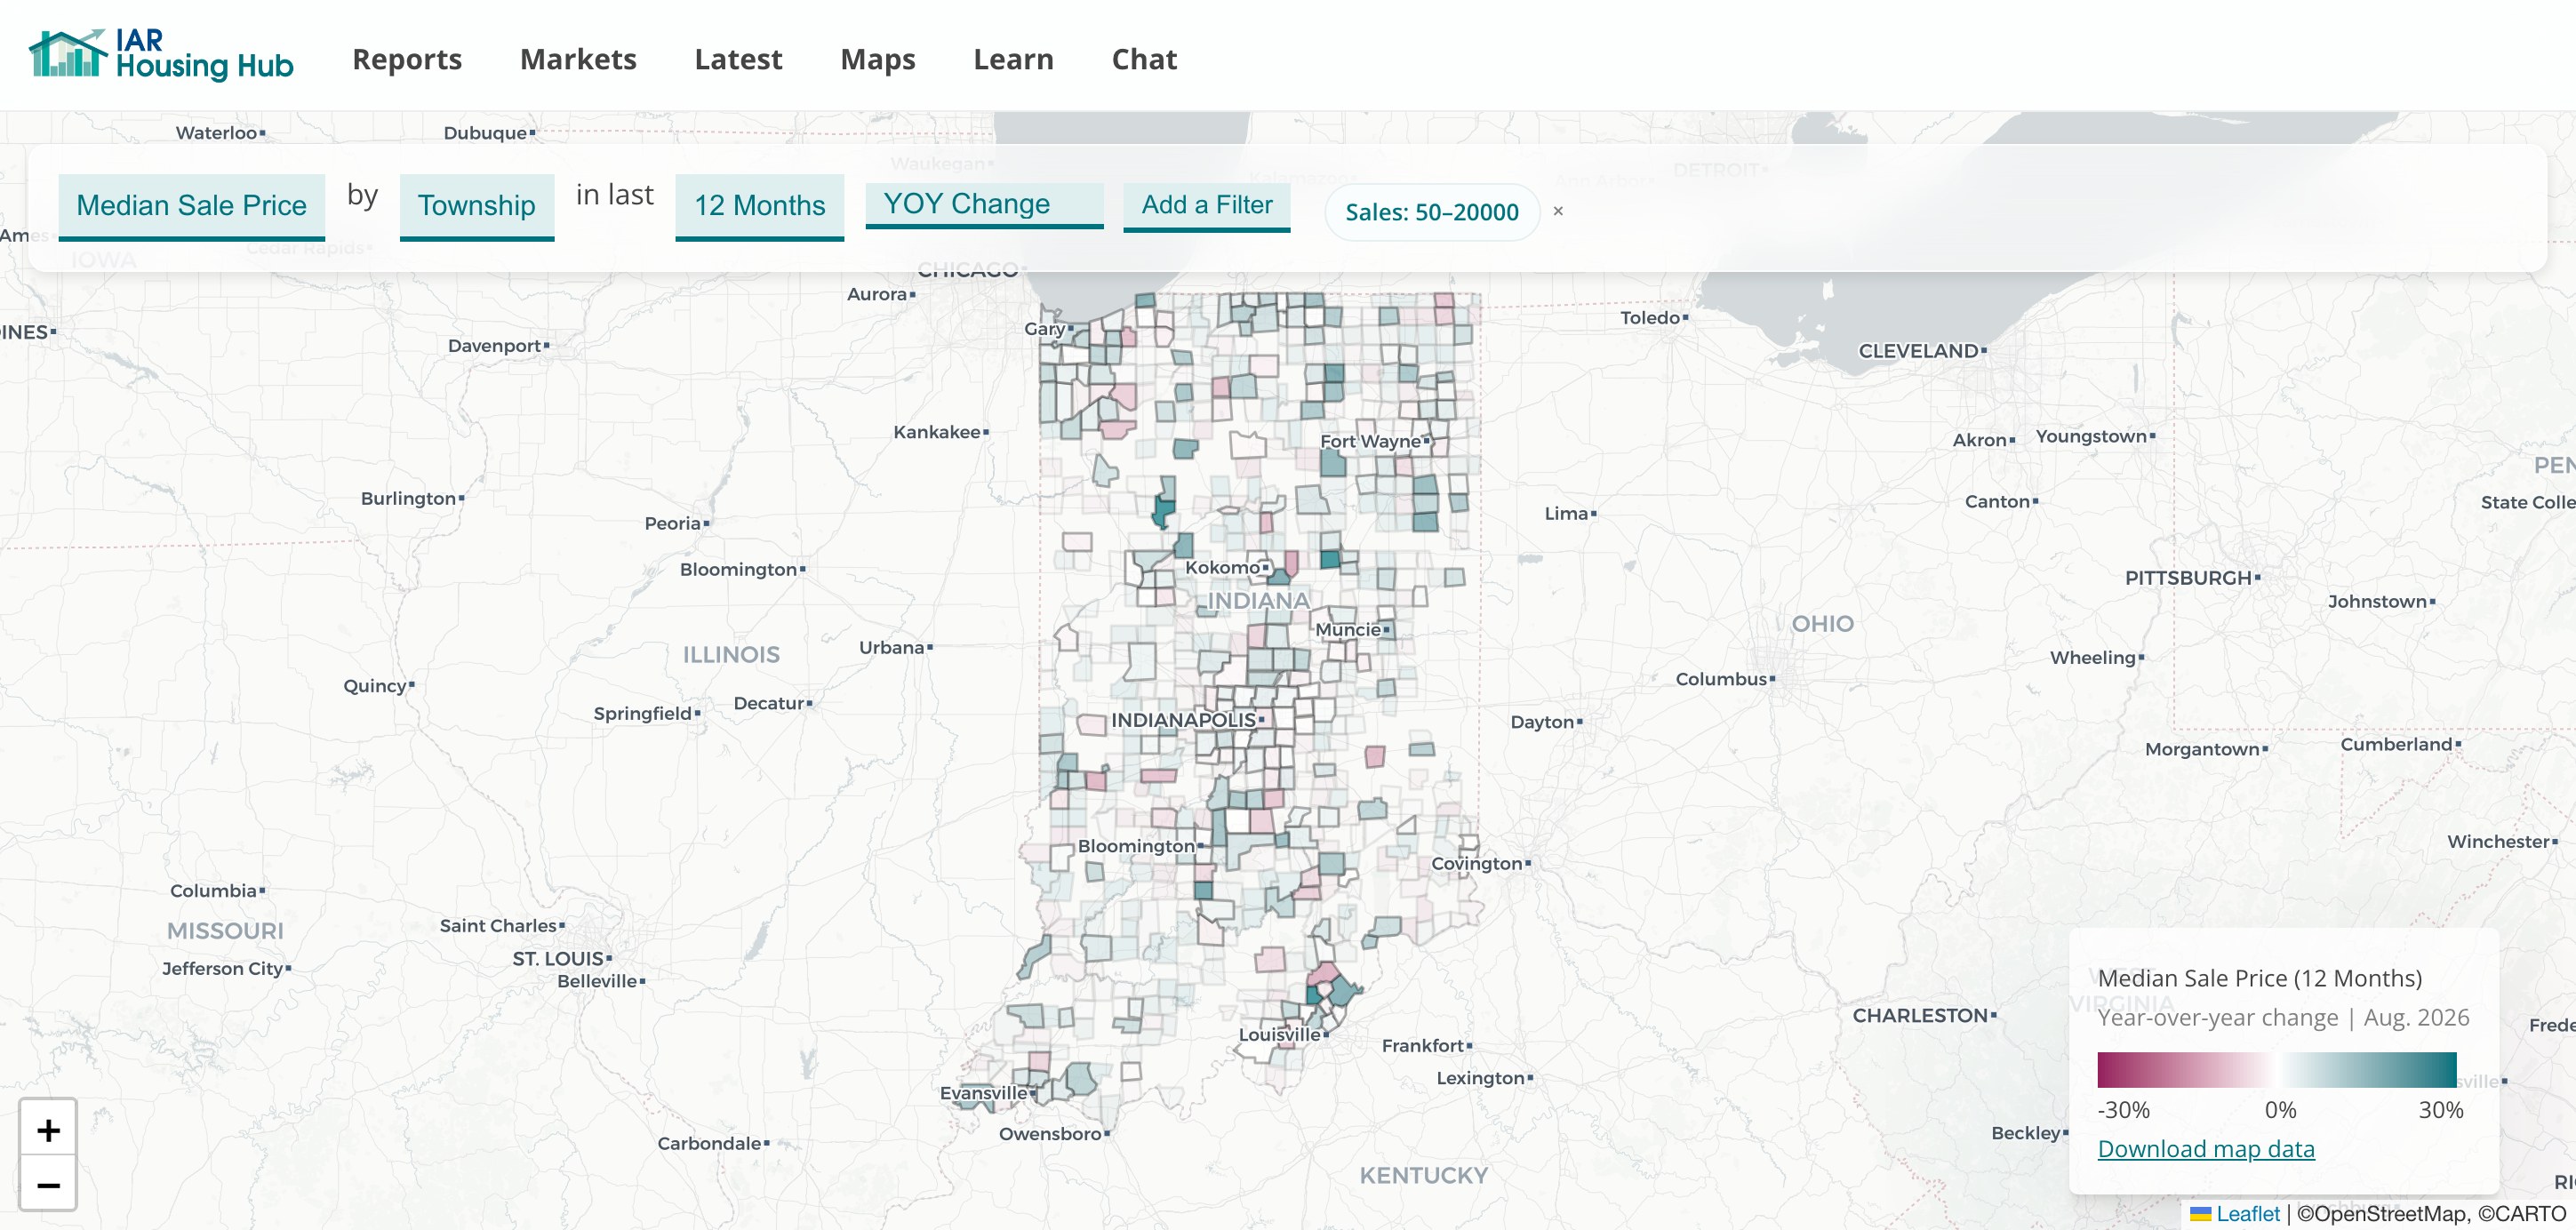
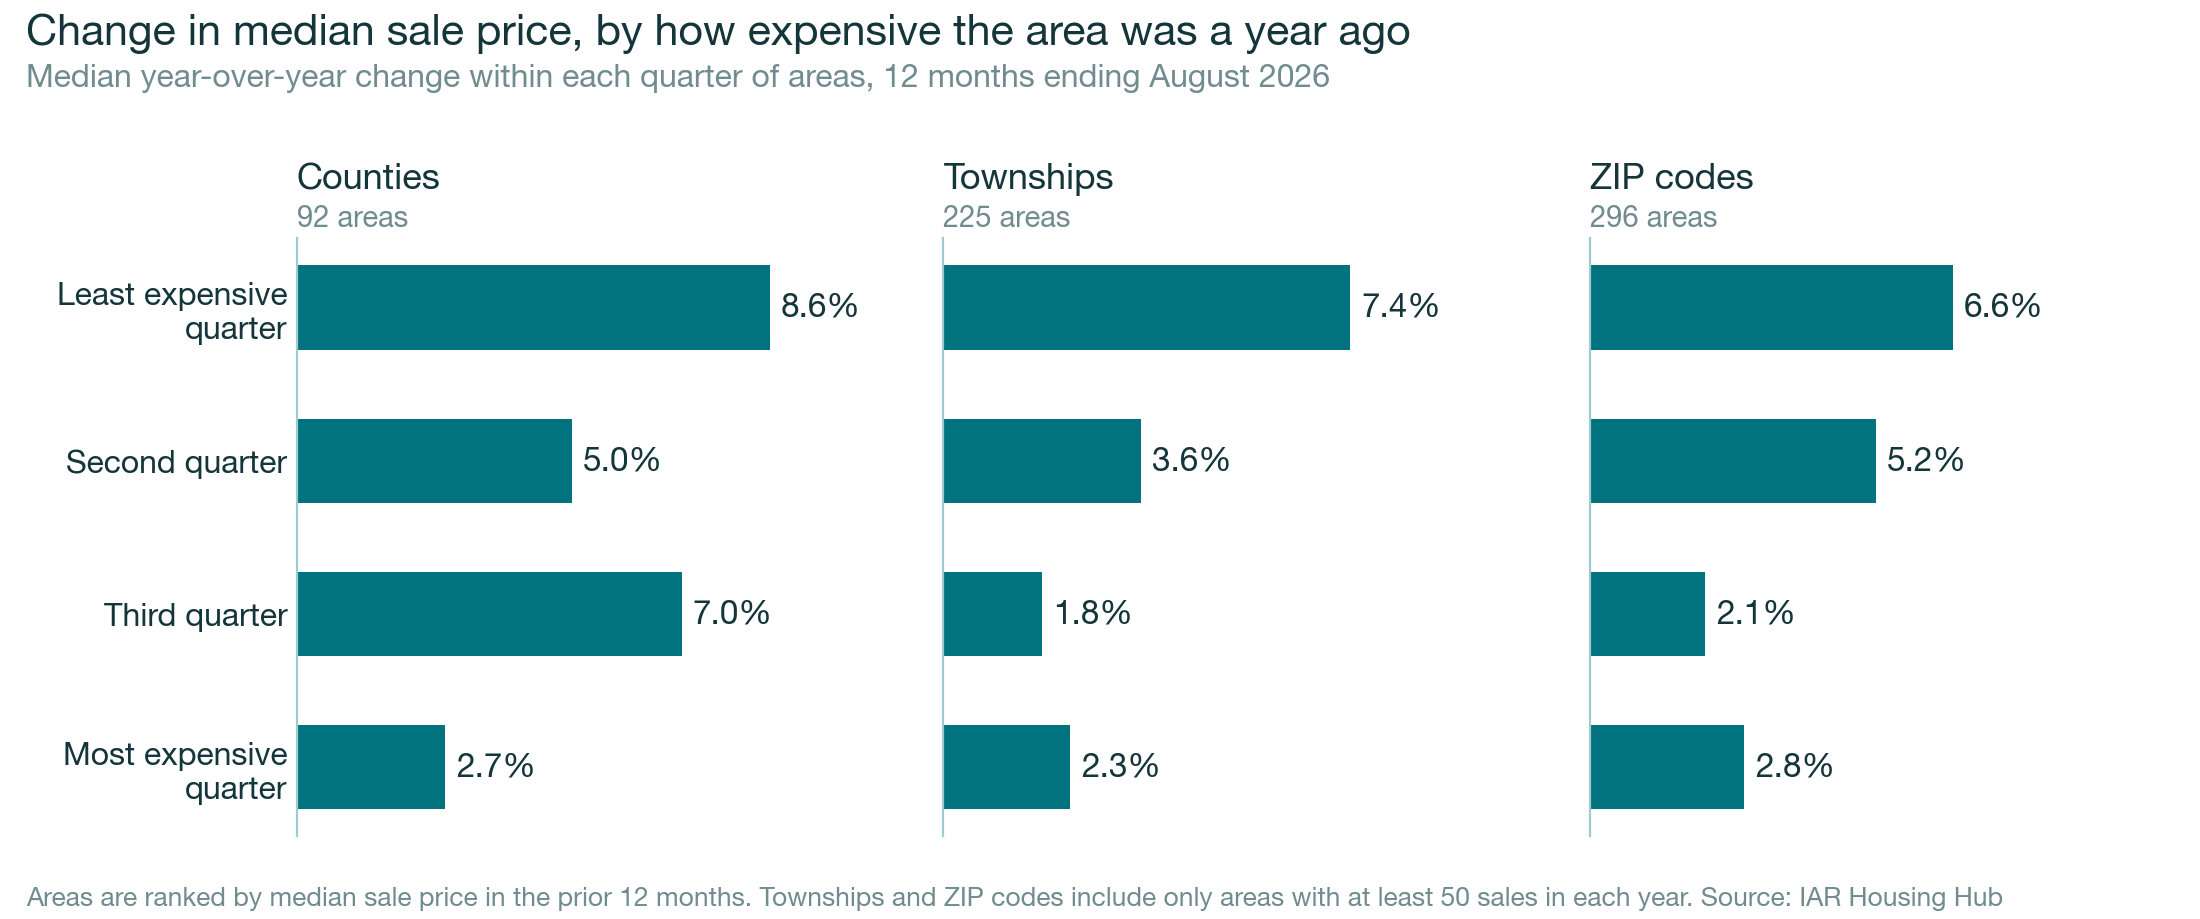
Yes. Among the 225 townships with at least 50 sales in each year, the cheapest quarter rose 7.4 percent at the median, and the other three quarters rose between 1.8 and 3.6 percent. The 296 ZIP codes that meet the same threshold show the same thing: 6.6 percent in the cheapest quarter and 2.8 percent in the most expensive.
Our "repeat sales" data measures something different: for each home that sold twice, the gain per year between the two sales. Because it follows the same house, it is not affected by the mix of homes sold.
It ranks cities the same way. Over the last 12 months, homes resold in South Bend had gained 8.0 percent per year, in Anderson 7.6 percent, and in Elkhart 7.4 percent. The statewide figure is 6.0 percent, and Indianapolis is at 5.8 percent. The lowest figures are in Bloomington (4.9 percent), Valparaiso (5.0 percent), Crown Point (5.1 percent), and Greenwood (5.2 percent).
No. When we split resales into four groups by price, the cheapest group gained 7.1 percent per year as of August and the most expensive gained 5.3 percent. But from late 2006 through early 2016, the cheapest group lost value between sales, as much as 19.6 percent per year in February 2009, while the most expensive group never fell below a 1 percent annual loss. The cheapest group passed the most expensive in March 2018 and has been the fastest-rising group in nearly every month since mid-2020.
Explore the full map. Map and repeat sales data are through August 2026.