 Reports
Markets
Latest
Maps
Learn
Spark
Reports
Markets
Latest
Maps
Learn
Spark
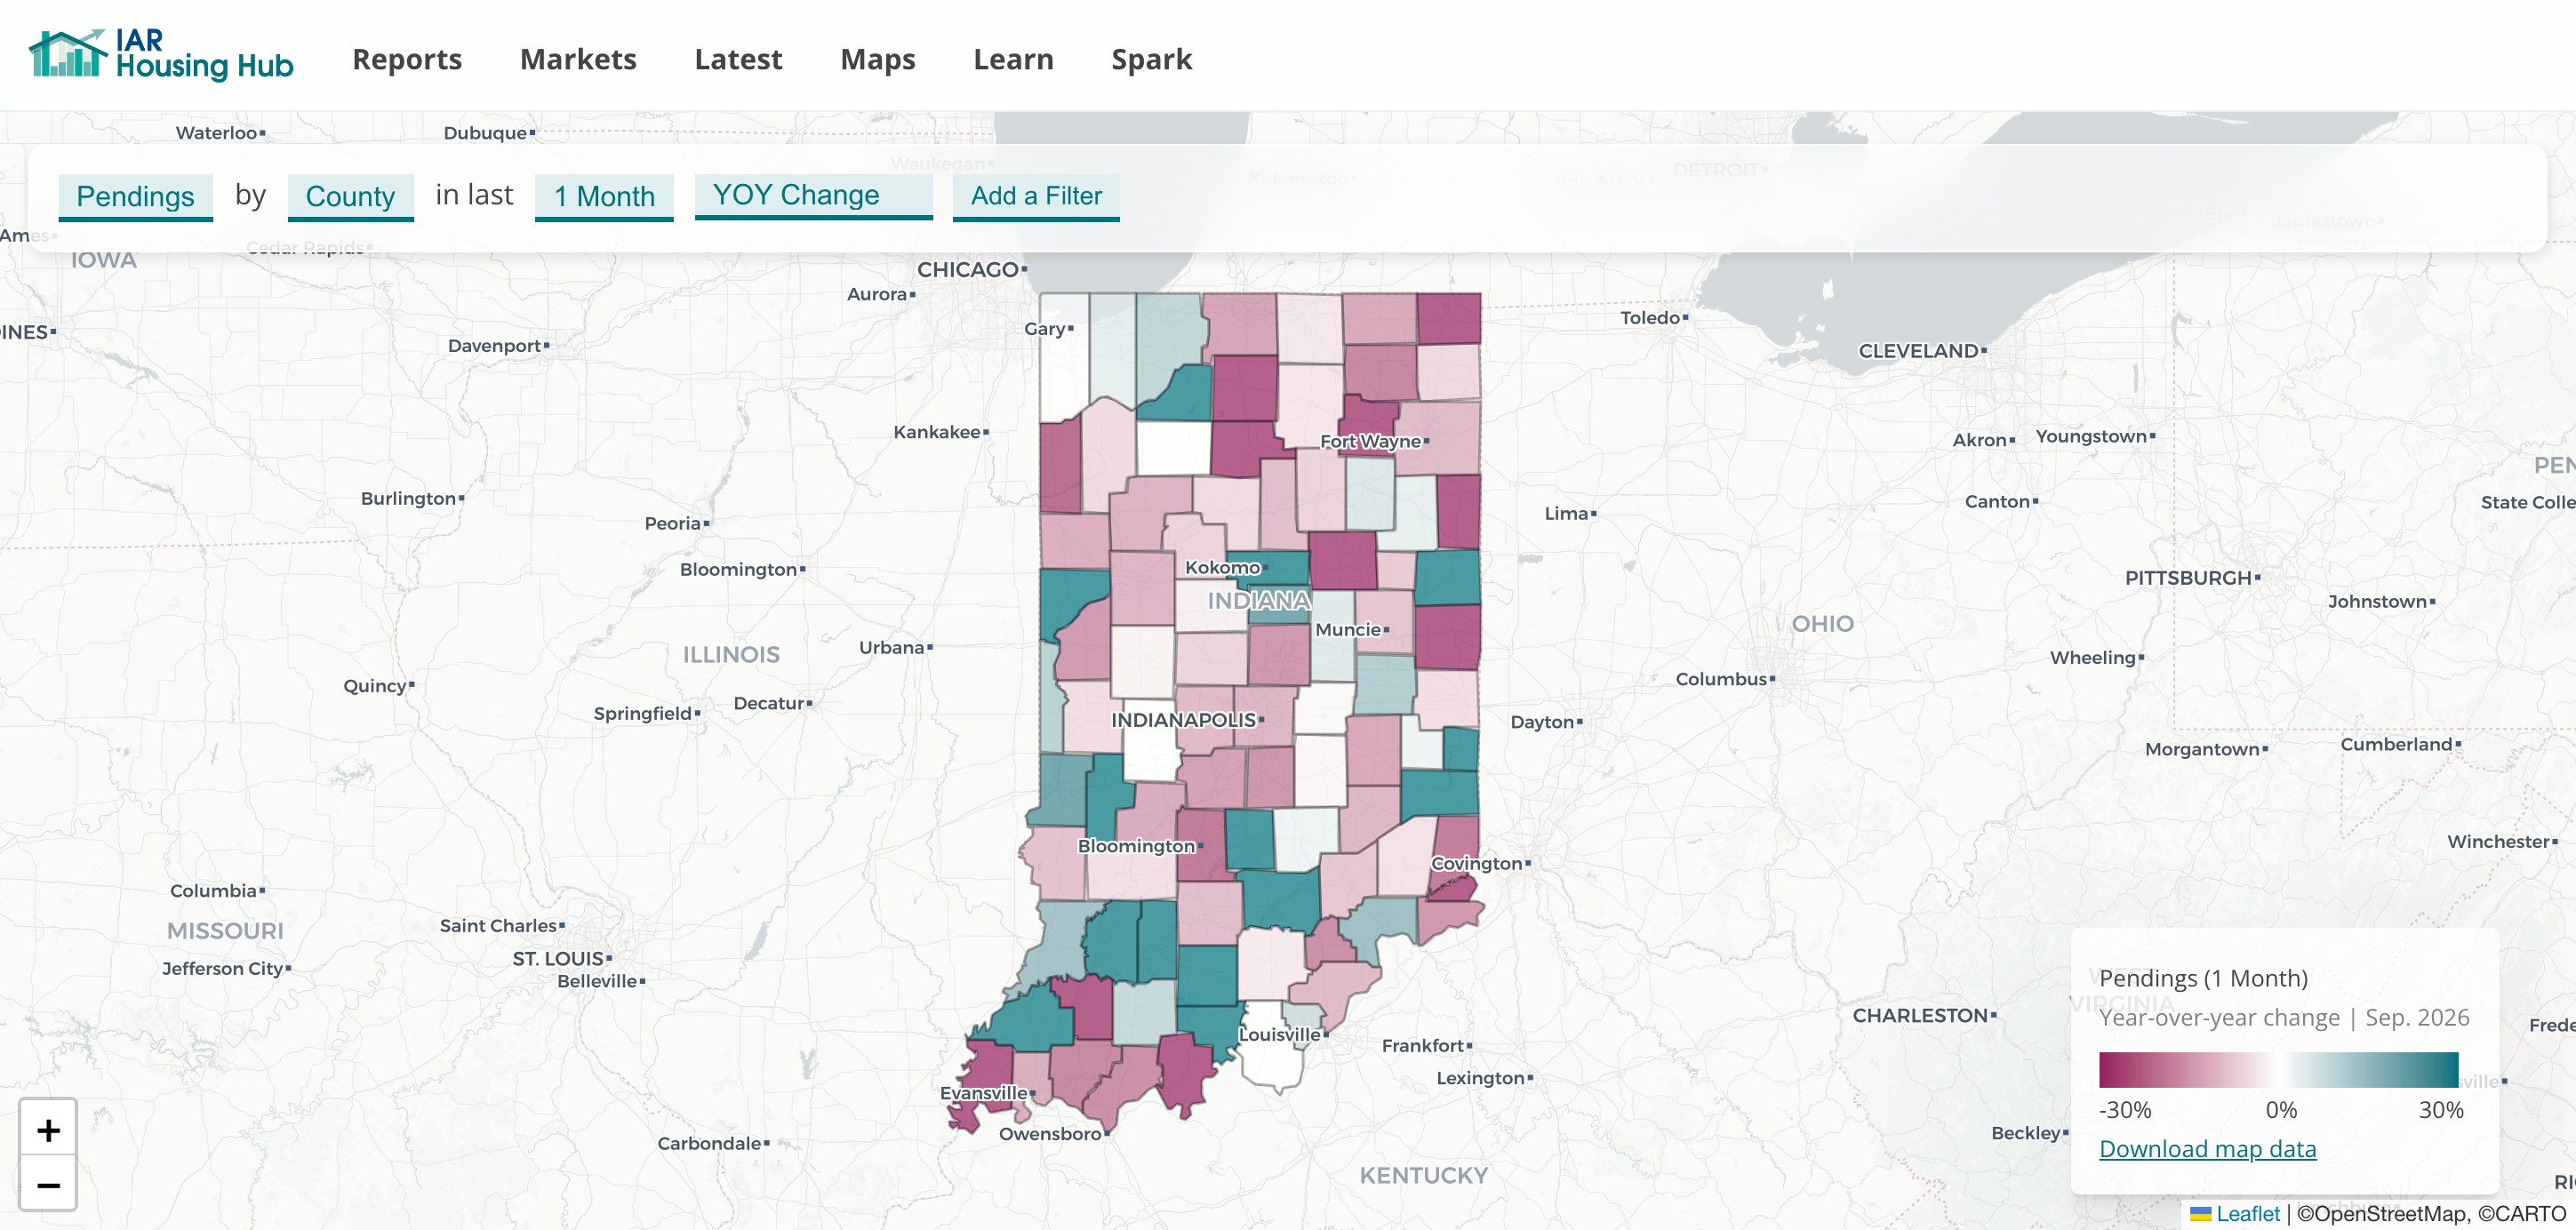
Indiana buyers put 7,318 homes under contract in September, 10 percent fewer than in September 2025 and 15 percent fewer than in August. Last year the drop from August to September was 9 percent. September is the first month since February with pendings below the range the Hub expects for the month, after a spring in which April, May and June all came in above it. Pendings fell in 60 of the 92 counties. Nearly all of the statewide decline came from the metro areas: the 41 counties in them had 10.4 percent fewer pendings than a year ago, and the other 51 counties had 1.5 percent fewer.
The large ones. Pendings fell 20 percent in Johnson and Hamilton counties, 17 percent in St. Joseph, 15 percent in Vanderburgh, 14 percent in Marion, Tippecanoe and Clark, and 13 percent in Hendricks and Allen. Every one of the five largest counties by sales was down.
The Fort Wayne area had the largest regional decline at 16.5 percent, followed by South Bend and Elkhart at 14.9 percent, Marion County at 13.6 percent, the Evansville area at 13.1 percent, and the Indianapolis suburban counties at 12.2 percent. The Indiana side of the Louisville metro area was down 6.3 percent.
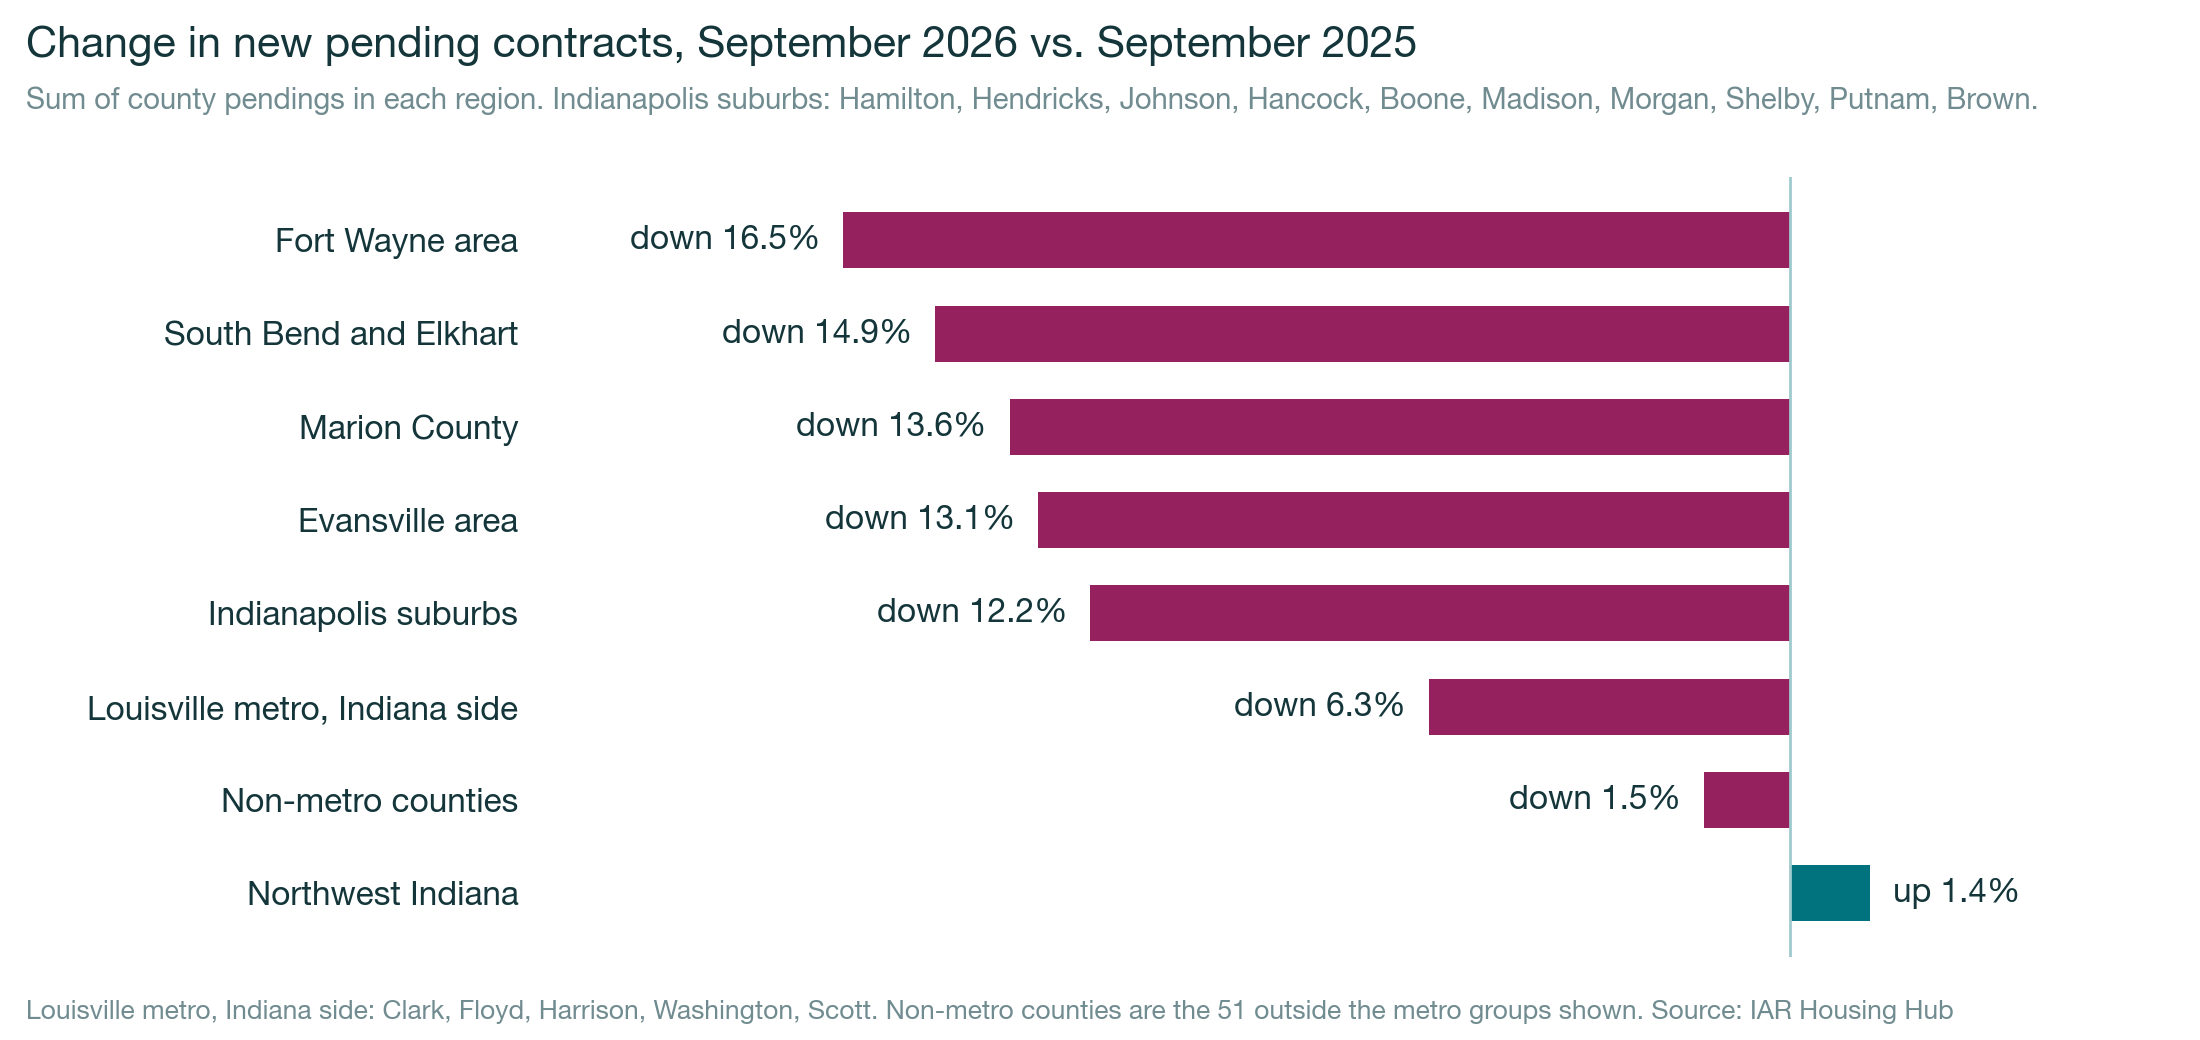
Northwest Indiana. Pendings in Lake, Porter, LaPorte, Jasper and Newton counties were up 1.4 percent from a year ago. Lake County was flat at 632 and Porter was up 4.5 percent, while new listings in both fell. LaPorte was up 11.5 percent.
Outside the metro areas the picture is mixed rather than strong. Pendings fell in 31 of the 51 non-metro counties, but gains in a few mid-sized markets offset them: Howard County was up 33 percent, Vigo up 25 percent, and Henry up 14 percent. (Monthly pendings in a county with 30 or 40 contracts can swing by a fifth on ordinary variation, so we read the small counties as a group, not one at a time.)
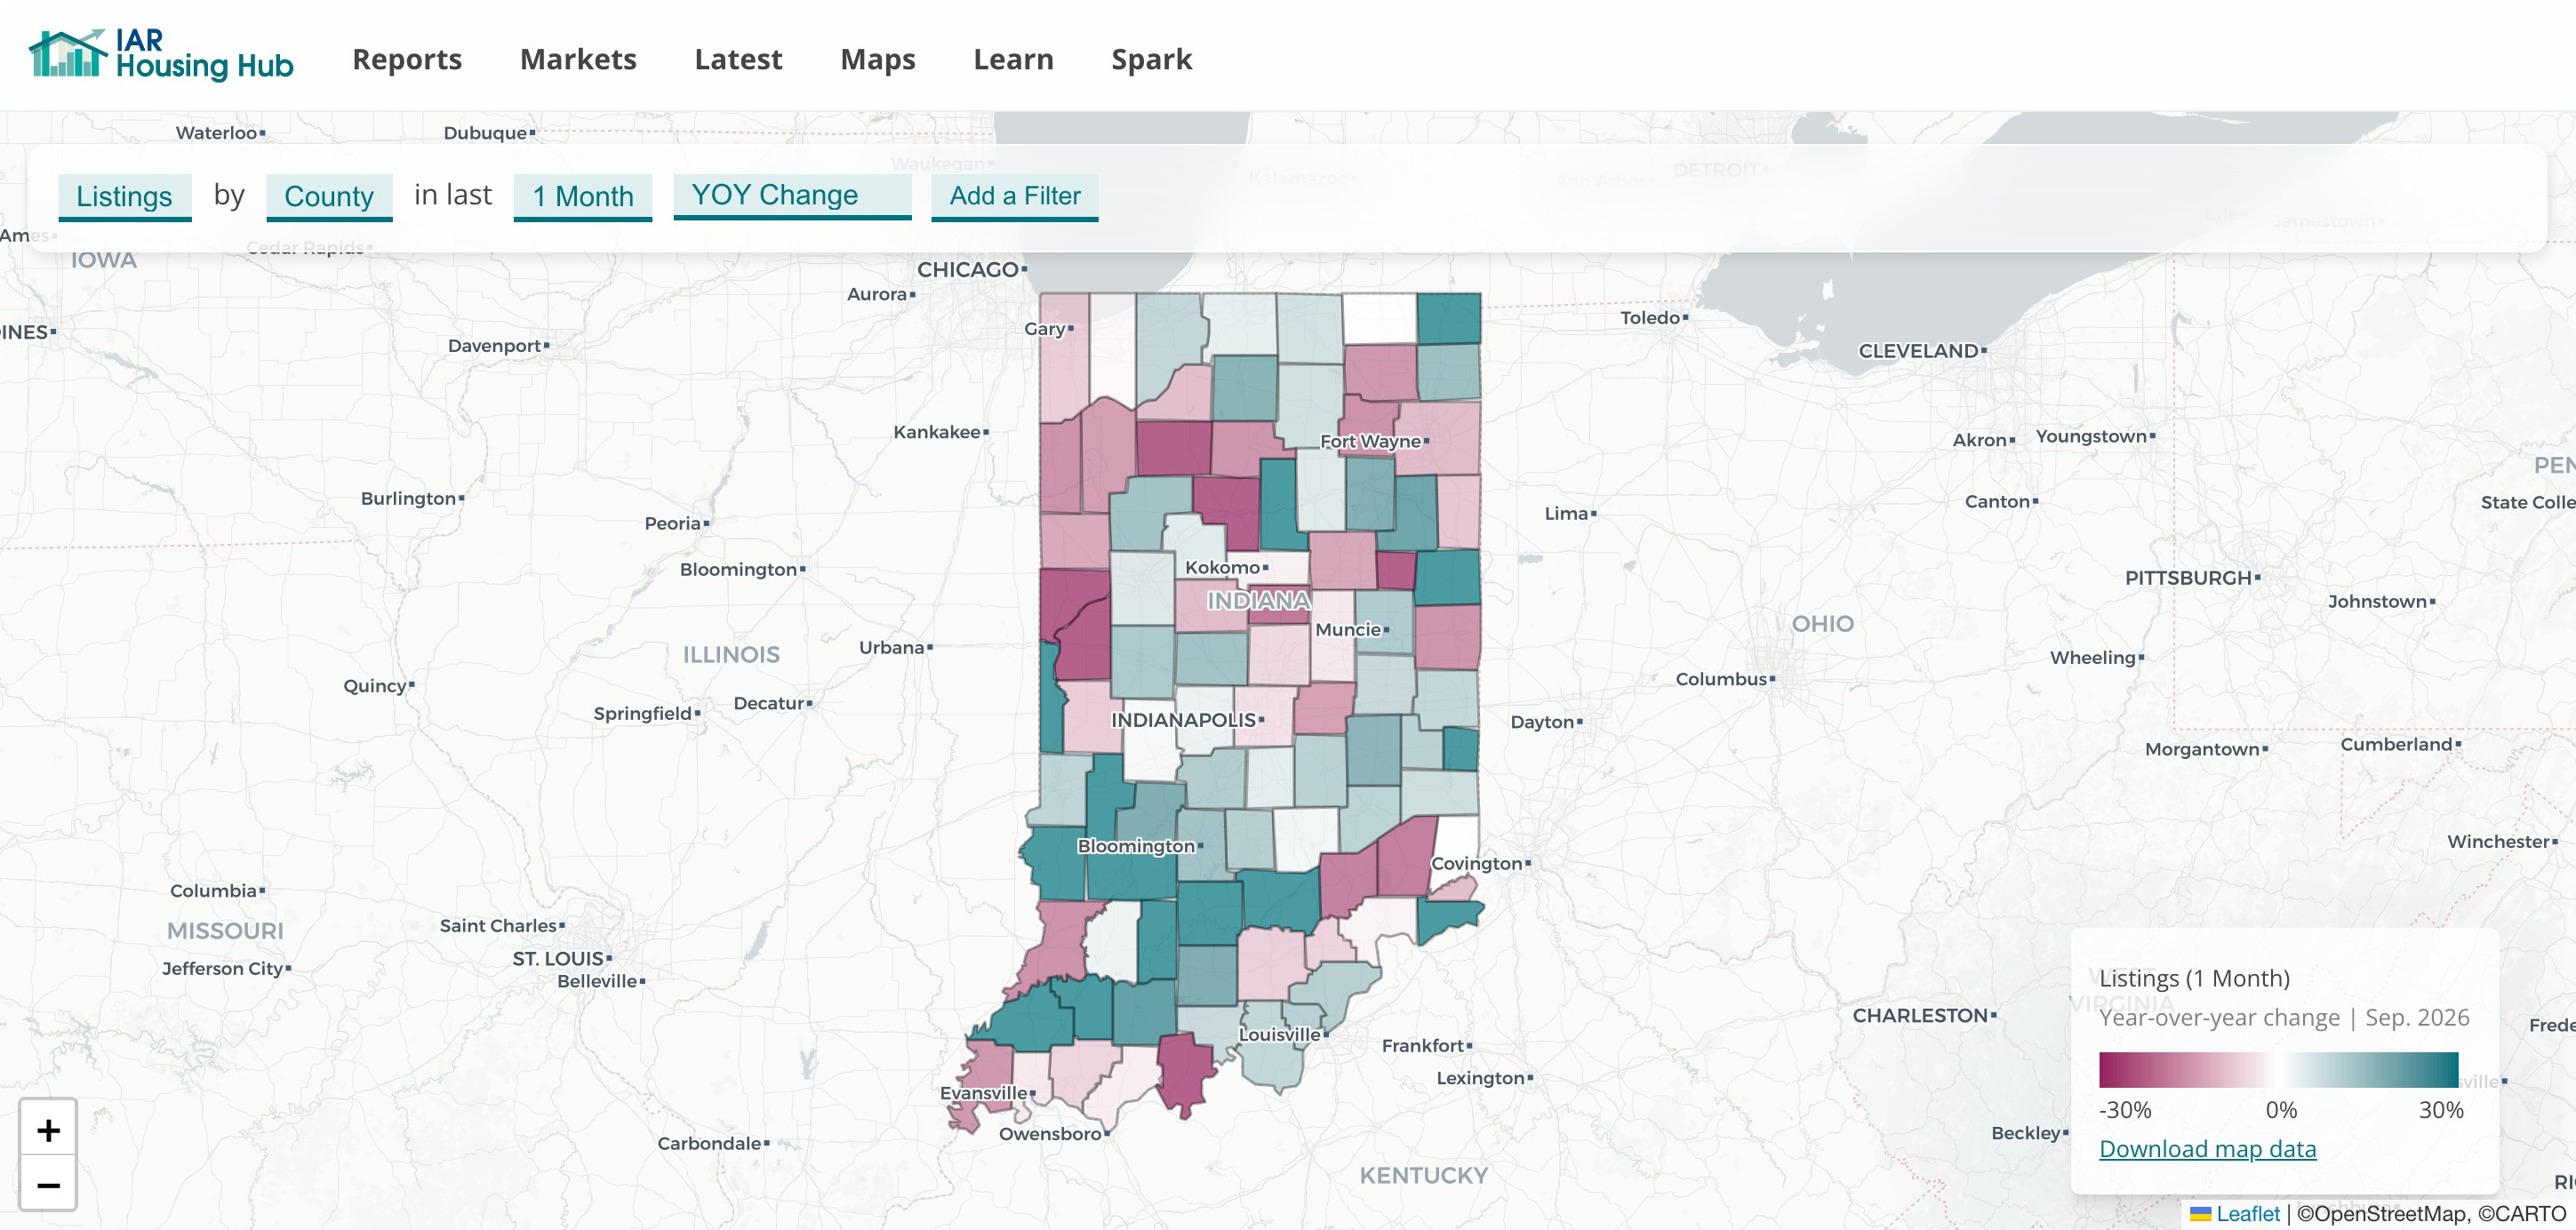
No. New listings were flat statewide, up 0.3 percent. The ratio of new pendings to new listings, which tells us how much of the incoming supply buyers are absorbing, fell from 0.81 last September to 0.74. The drop is sharpest where listings were plentiful: in Johnson County the ratio went from 0.99 to 0.75, in Hendricks from 0.93 to 0.78, in Hamilton from 0.87 to 0.75, and in St. Joseph from 0.83 to 0.66. In Lake and Porter the ratio rose, to 0.91 and 0.90.
Mostly. We sorted counties into four groups by median sale price. The two most expensive groups, which account for four of every five pendings in the state, had 10 to 12 percent fewer pendings than a year ago. The two cheaper groups were flat: down 4 percent in the least expensive counties and up 4 percent in the next group. Days on market moved the same way. The median in the most expensive group went from 23.5 to 27 days, and in the least expensive group it fell from 32 to 26.5. Hamilton County went from 19 days to 29, Hancock from 25 to 43, and Hendricks from 22 to 29.
The ZIP code map agrees. Among the 145 ZIP codes with at least 20 pendings last September, 94 were down, and the median change was minus 10 percent.
Some of September's decline will be revised away. Agents post pending status after the fact, so the most recent weeks are always lighter in our data than they turn out to be; the three-week average through September 28 shows a 17.6 percent decline that we expect to shrink. The full-month figure of 10 percent is the one to use. Closed sales, which follow pendings by one to two months, were down 2.3 percent in September, so the October and November sales reports will show whether the metro slowdown carried through.
Explore the full map. Map data is through September 2026.