
We built the Indiana Market Index to describe every Indiana market two ways: market momentum, which compares a market with the same weeks a year earlier, and market competition, which compares it with other Indiana markets right now. Statewide, momentum shows Indiana cooling: in the three weeks ending October 11, pending contracts were down 13 percent from a year earlier (5,135 against 5,923). But the cooling is not spread evenly. Of Indiana's 92 counties, 31 are cooling and 32 are heating, counting only the counties where we are at least 80 percent confident of the direction. The clearest cooling is in the Indianapolis suburbs, including some of the state's most competitive markets. The clearest gains are in smaller counties where pending contracts have been rising for months.
| Momentum compared to last year | Counties | Examples |
|---|---|---|
Heating up | 32 | Clay, Jasper, Brown, Boone |
About the same | 9 | Vigo, LaPorte, Greene, Whitley |
Cooling | 31 | Hamilton, Hendricks, Johnson, Marion |
Too few sales to tell | 20 | Ohio, Parke, Blackford, Martin |
Market momentum combines four numbers, each compared with the same weeks last year: pending contracts, new listings, days on market, and the share of list price that homes sell for. More contracts, more new listings, faster sales, and higher sale-to-list prices all count as heating. Each change is scaled to a typical yearly change in a large Indiana county, then the four are averaged. A score of 0 means about the same as last year. A score of 100 means the market moved about twice as much as a typical year, in the heating direction.
Market competition blends three numbers from the latest three weeks: how fast homes go under contract, how many listings go under contract, and how close homes sell to their asking price. Each market is ranked against other Indiana markets of the same kind and shown as a percentile. A county at 90 percent is more competitive than 90 percent of Indiana counties.
The two halves of the index answer different questions, and they can disagree. Hamilton County is more competitive than 90 percent of Indiana counties, but it is cooling compared to last year.
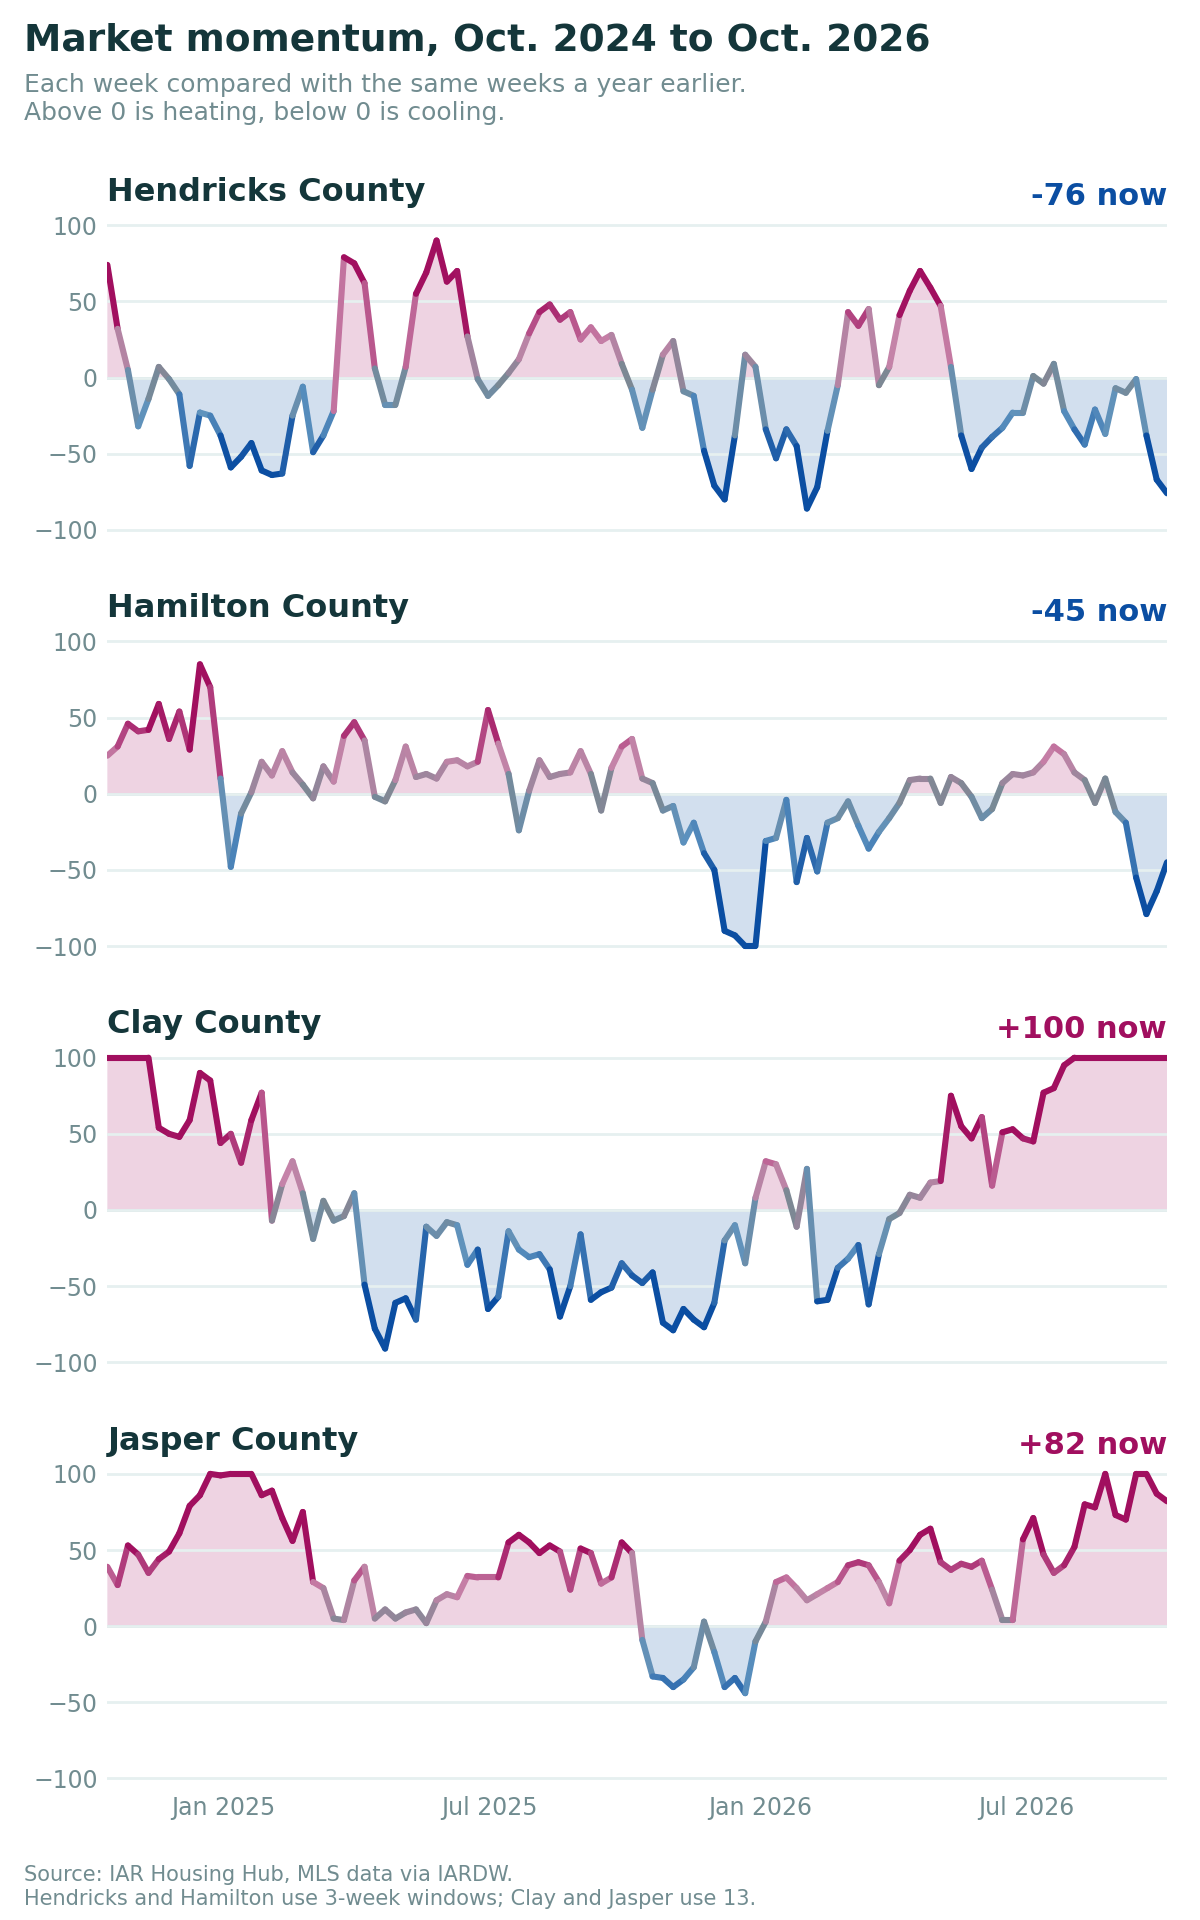
The Indianapolis suburbs are cooling faster than the state, even though most of them are still more competitive than the typical Indiana county. In Hamilton County, pending contracts fell 13 percent from a year earlier (394 against 456), and homes that went under contract took 29 days to do it, seven days longer than a year ago. In Johnson County, pending contracts fell 16 percent and homes took 13 days longer. Hendricks County had the sharpest drop: 144 pending contracts against 209 a year ago, a 31 percent decline, with 13 percent fewer new listings.
Marion County is cooling at about the state's rate, with pending contracts down 15 percent (714 against 844).
Three weeks is a short window, and a single county's score can swing. Hendricks County read +70 in May and reads -76 now. The suburban pattern is worth watching because it shows up in several counties at once, not because any one reading is final.
No. Boone County is the exception. Its pending contracts are down 7 percent over the last 13 weeks, but new listings are up 14 percent and homes are selling 23 percent faster. Its momentum has been above 0 in 25 of the last 26 weeks.
The steadiest gains are in smaller counties, and they are carried by pending contracts. Smaller counties sell too few homes for a three-week comparison, so we compare 13 weeks (July 13 to October 11) with the same 13 weeks last year.
| County | Pending contracts, Jul 13 to Oct 11 | Same weeks, 2025 | Change | Competition |
|---|---|---|---|---|
| Clay | 120 | 89 | +34% | 96% |
| Jasper | 152 | 121 | +26% | 100% |
| Franklin | 68 | 55 | +24% | 95% |
| Brown | 93 | 76 | +22% | 74% |
| Indiana | 25,602 | 27,074 | -5% |
These counties are also among the most competitive in the state. Clay County is more competitive than 96 percent of Indiana counties, and its momentum has been above 0 every week for six months. In Jasper County, homes went under contract in 20 days, down from 42 a year earlier.
These are small counts, and a dozen contracts can move a percentage a long way. That is why we use the longer window for small counties, and why the Hub only shows a direction when it is at least 80 percent confident the direction is right.
Every market and neighborhood snapshot on the Hub now opens with the Indiana Market Index: one sentence that names both halves, then a card for each. The momentum card shows the last two years and the four numbers behind the score. The market competition card shows where the market ranks among Indiana markets of the same kind. Favorite markets and saved neighborhoods in the sidebar now show an arrow for momentum: up for heating, down for cooling, sideways for about the same, and a dash when there are too few sales to tell.