
Unemployment rates in September were higher than a year earlier in 10 of the 12 Indiana metropolitan areas. The Indianapolis metro was unchanged at 3.4 percent, and Kokomo was the only area with a lower rate. Nationally, rates were lower than a year ago in 58 percent of metro areas and higher in 36 percent. Fort Wayne, Lafayette-West Lafayette and the Indianapolis metro had the lowest rates in the state at 3.4 percent. Kokomo had the highest at 4.6 percent, followed by Muncie at 4.2 percent and South Bend-Mishawaka at 4.1 percent. Those three were above the national rate of 4.0 percent.
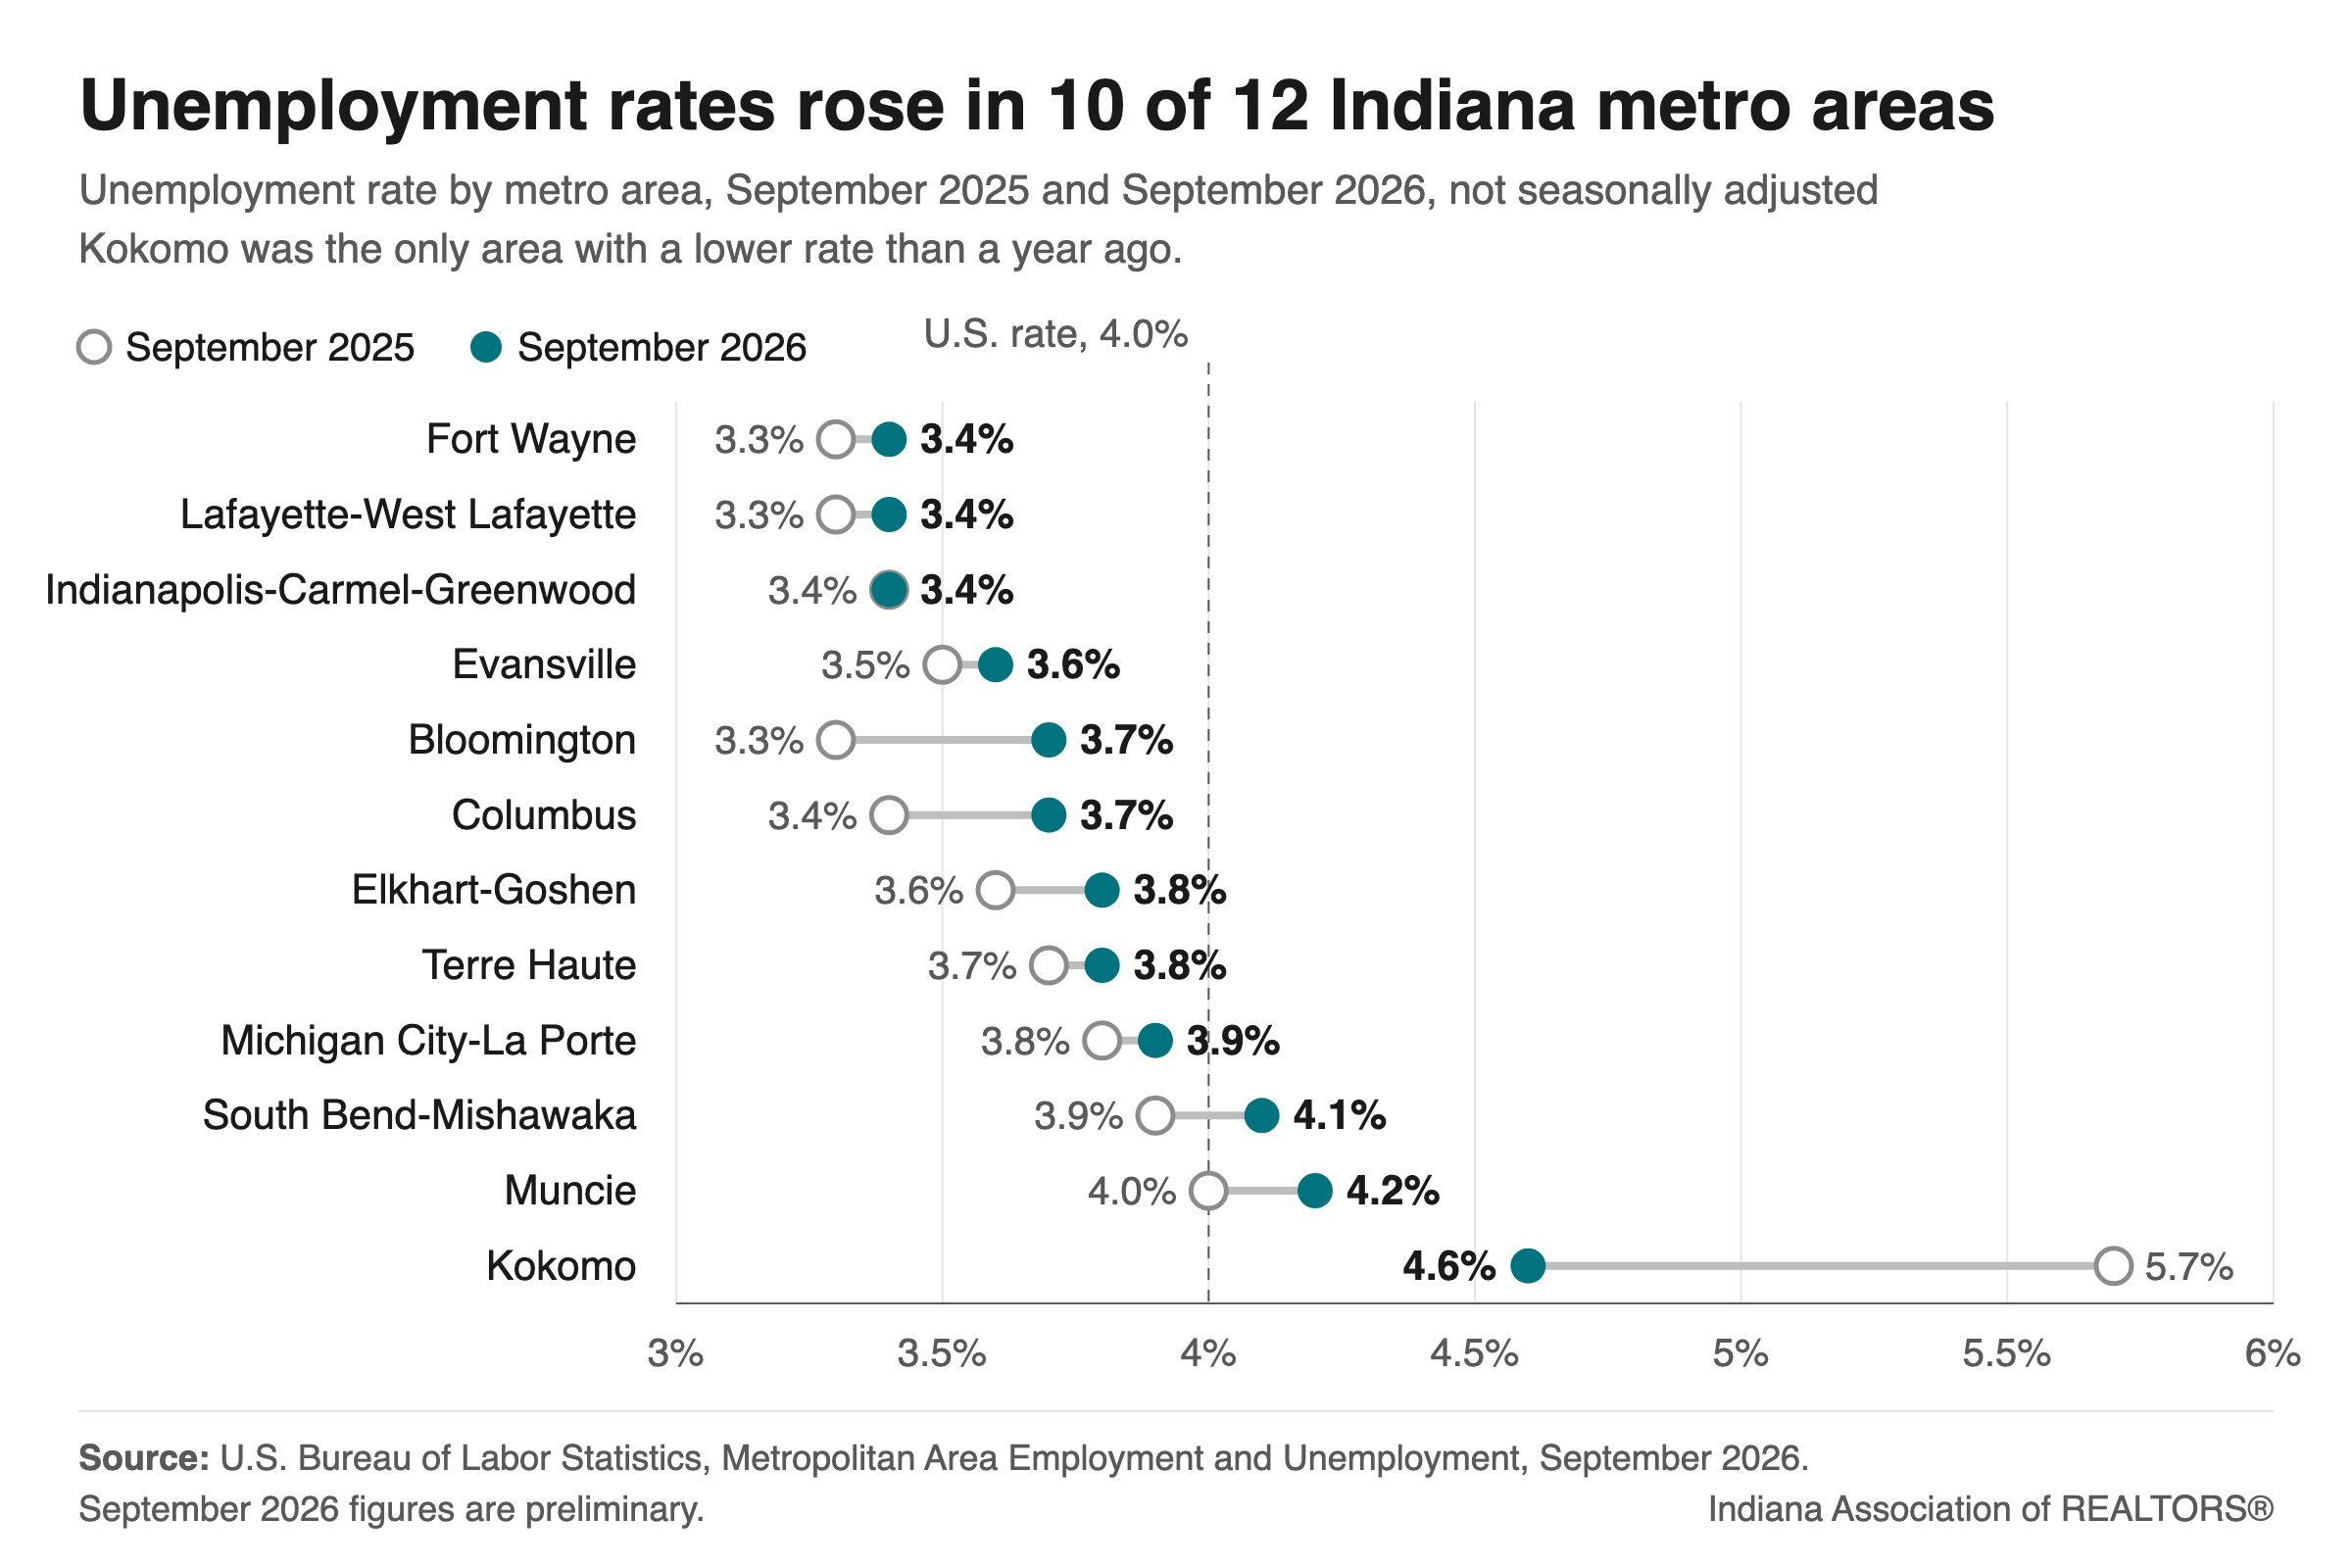
Metro area rates are not seasonally adjusted, so we compare September with September of last year. On this basis, Indiana's statewide rate was 3.7 percent, up from 3.5 percent. The 3.4 percent statewide rate reported last week is the seasonally adjusted figure.
The increase from a year ago is mostly a change in the seasonal pattern. Rates usually fall between August and September as students return to school and summer job seekers leave the labor force. Last year, the September rate was below the August rate in all 12 metro areas, by 0.1 to 0.7 percentage points. This year, the rate rose or held from August to September in 10 of the 12. In August, every Indiana metro area was below its year-earlier rate.
The number of unemployed residents rose from a year ago in every metro area except Kokomo, but the increases were small: about 730 in the Indianapolis metro and fewer than 230 everywhere else. The larger change is in employment. The number of employed residents fell in eight of the 12 metro areas, and the labor force, the residents who are working or looking for work, shrank in eight. Statewide, about 13,500 fewer residents were employed than a year ago. The Indianapolis metro had about 7,300 fewer employed residents and a labor force about 6,600 smaller. Its rate held at 3.4 percent only because the labor force shrank; with a labor force the size of last September's, the rate would be 4.0 percent.
Bloomington had the largest increase, from 3.3 percent to 3.7 percent. About 3,900 fewer Bloomington-area residents were employed than a year ago, a 4.7 percent decline, and the labor force shrank by about 3,700. Employers in the area reported 3,800 fewer payroll jobs than a year earlier, also a 4.7 percent decline. That is the largest percentage decline of any metro area in the country for the second month in a row, and it remains the only payroll change among Indiana metro areas that BLS counts as statistically significant. State government payrolls, a category that includes Indiana University, fell from 17,300 to 13,400. Private employers reported 57,400 jobs, about the same as a year ago.
Fort Wayne, Lafayette-West Lafayette and Michigan City-La Porte are the exceptions. In each, the labor force grew and more residents were working than a year ago, by about 700 in Fort Wayne and Lafayette-West Lafayette and about 450 in Michigan City-La Porte. Their rates rose by 0.1 percentage point because the labor force grew a little faster than employment.
What does this mean for the housing market? Fewer residents are working than a year ago in most Indiana metro areas, which weighs on housing demand. Fort Wayne, Lafayette-West Lafayette and Michigan City-La Porte are the exceptions. Even so, more than 95 percent of the labor force has a job in every metro area, so the job market is not the main constraint on buyers. Interest rates are. The average 30-year mortgage rate rose from 7.03 percent in the week of Sept. 24 to 7.40 percent in mid-October and was 7.32 percent in the week of Oct. 22, according to Freddie Mac.
The September figures are preliminary. The state report for October comes out Nov. 20, and the October metro report comes out Dec. 2.
Sources: U.S. Bureau of Labor Statistics (BLS), Metropolitan Area Employment and Unemployment, September 2026 (preliminary); Local Area Unemployment Statistics; and Current Employment Statistics for states and metro areas. Labor figures are not seasonally adjusted. Mortgage rates are from the Freddie Mac Primary Mortgage Market Survey.