
Unemployment rates in August were lower than a year earlier in all 12 Indiana metropolitan areas. Nationally, rates were lower in 234 of 387 metro areas. Fort Wayne and Indianapolis-Carmel-Greenwood had the lowest rates in the state at 3.3 percent. Kokomo had the highest at 4.6 percent and was the only Indiana metro area above the national rate of 4.3 percent. Even so, Kokomo's rate improved substantially from 6.4 percent in August 2025.
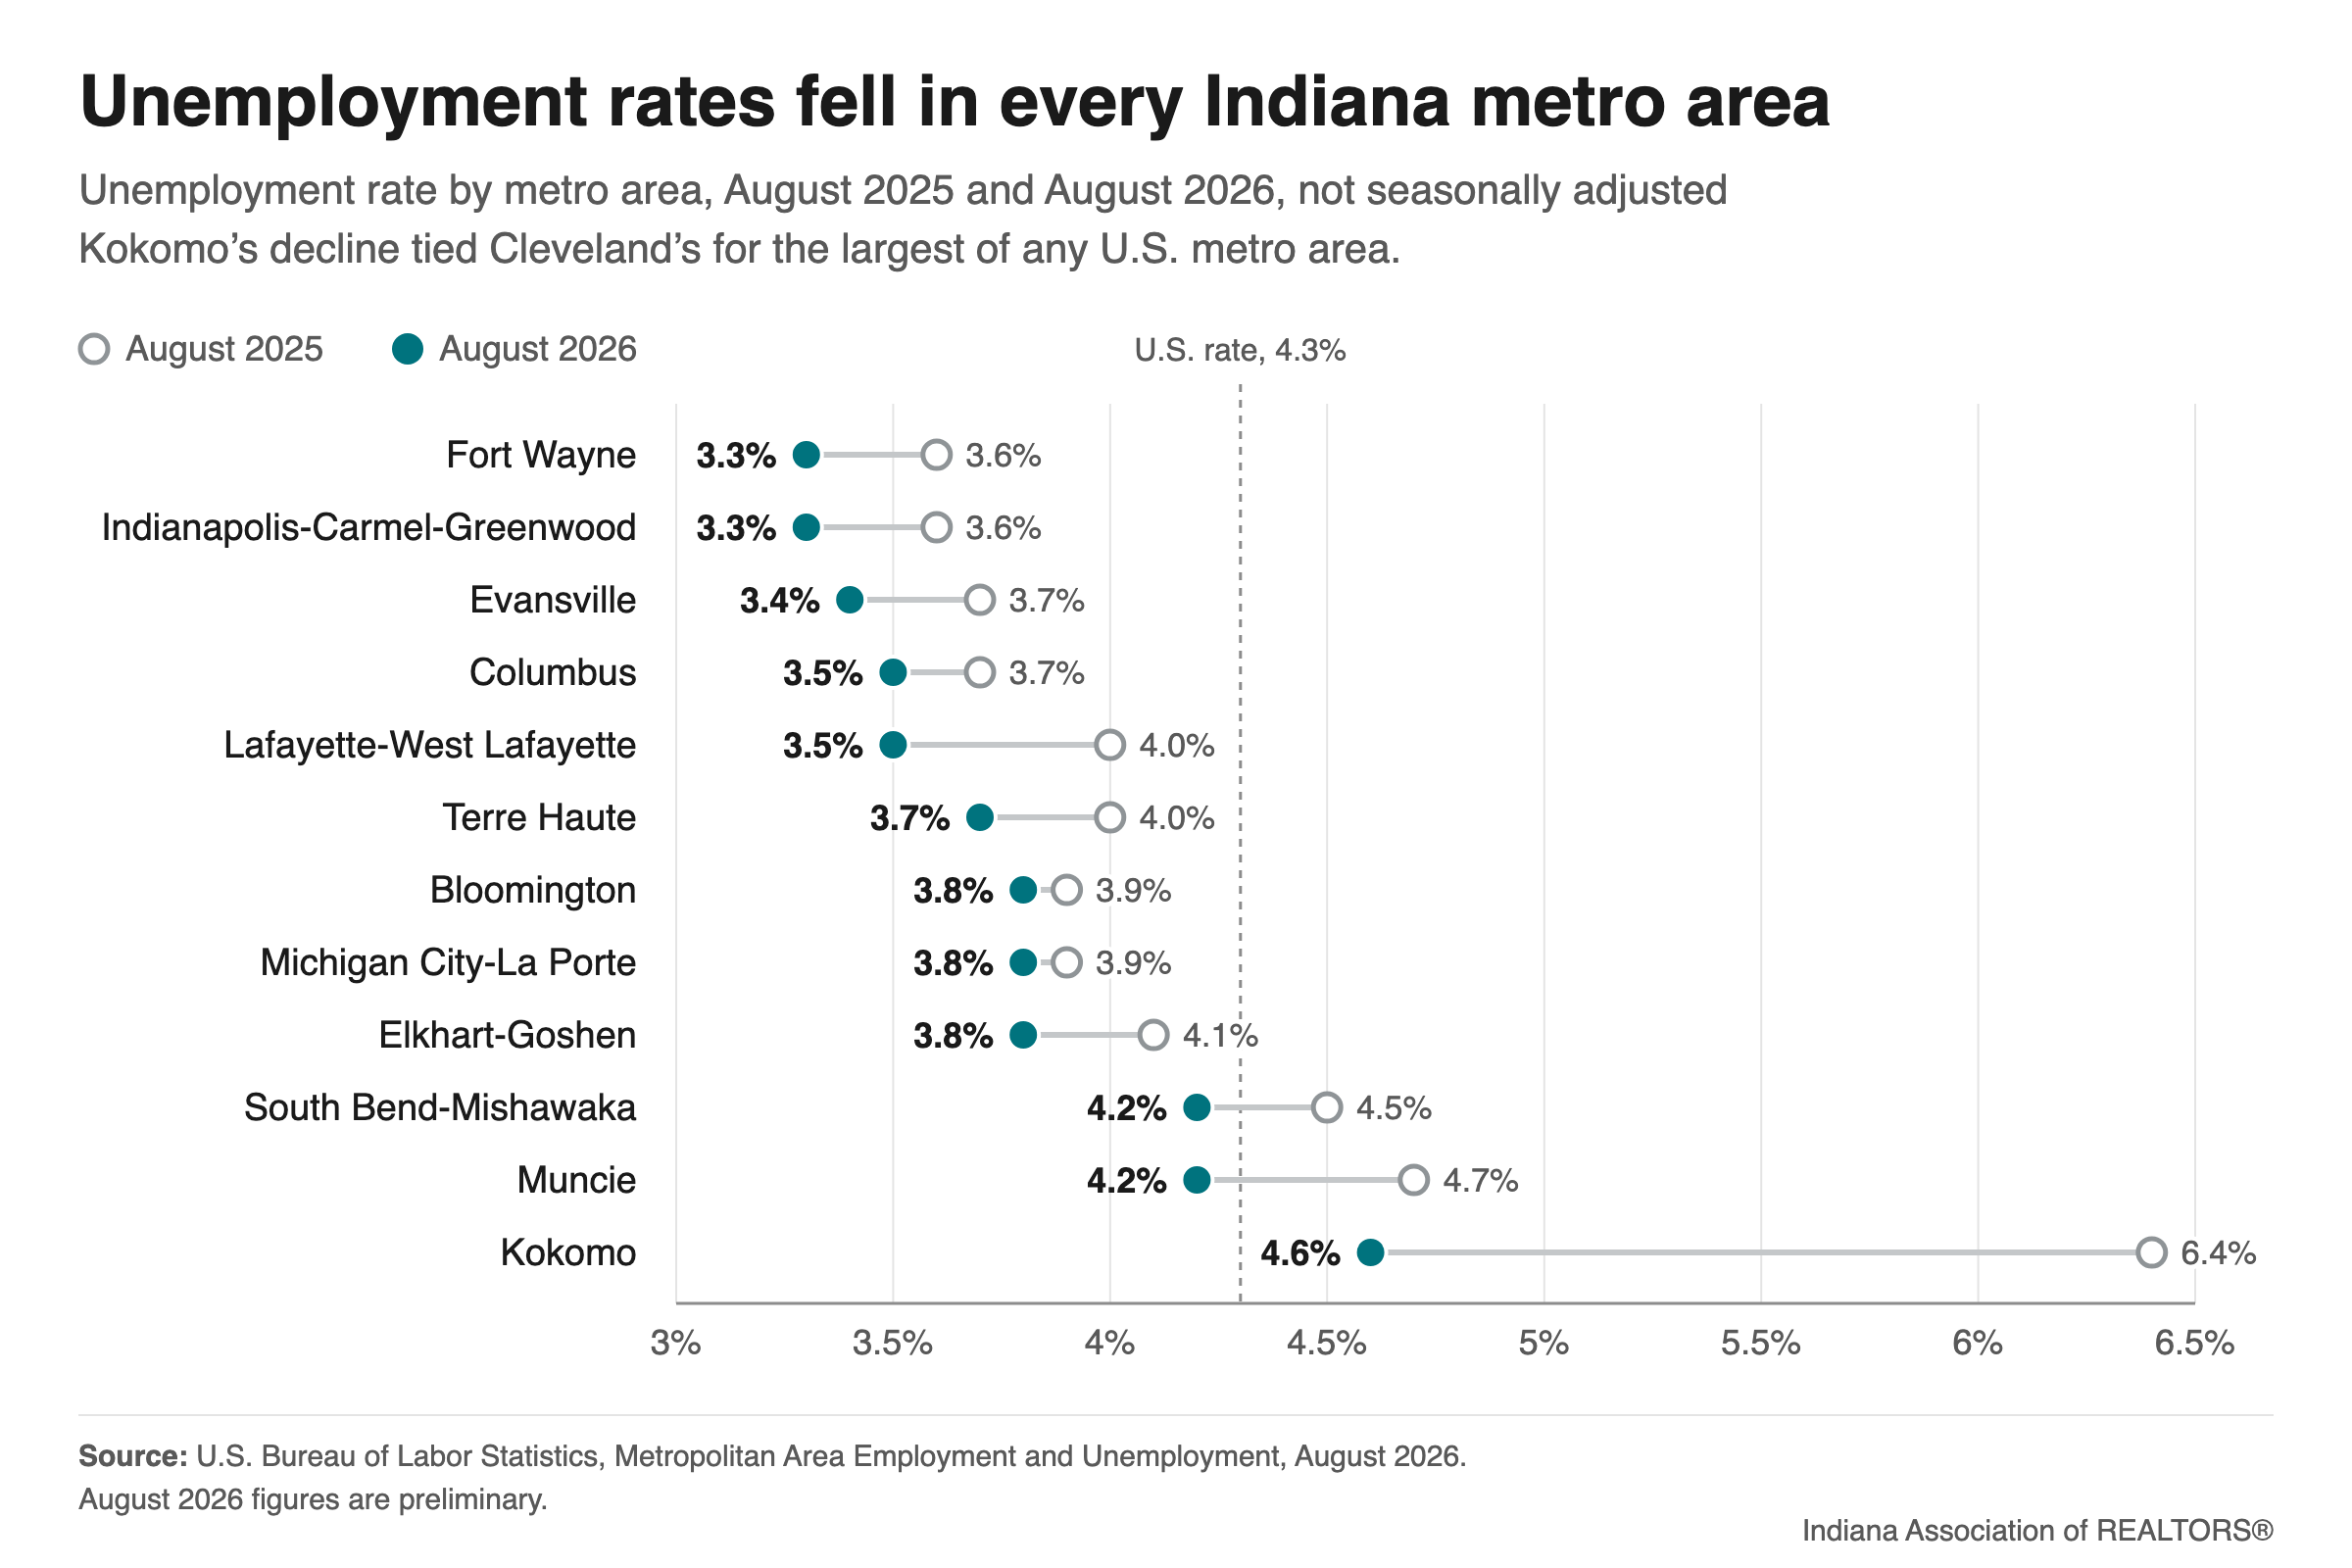
Metro area rates are not seasonally adjusted, so we compare August with August of last year and not with July. On this basis, Indiana's statewide rate was 3.6 percent, down from 3.8 percent. The 3.3 percent statewide rate reported earlier in September is the seasonally adjusted figure.
Kokomo's decline of 1.8 percentage points tied Cleveland for the largest of any metro area in the country. Kokomo's rate was 10.3 percent in August 2024. Over the past year, the number of unemployed residents in the Kokomo area fell by about 680, but the number of employed residents rose by only about 70. The labor force shrank by about 620.
As in the statewide numbers, a smaller labor force explains much of the decline in other metro areas. The labor force, the residents who are working or looking for work, shrank in nine of the 12 metro areas, and the number of employed residents fell in seven. The Indianapolis area's labor force fell by about 15,500, or 1.3 percent, and about 12,100 fewer residents were employed. The Indianapolis area has one-third of the state's labor force and accounts for nearly half of the statewide decline of about 32,300.
Lafayette-West Lafayette, Terre Haute and Michigan City-La Porte are the exceptions. In each, the labor force grew and more residents were working than a year ago. Lafayette-West Lafayette had about 1,200 more employed residents, and its rate fell from 4.0 percent to 3.5 percent.
Employers in the Bloomington area reported 4,800 fewer payroll jobs than a year earlier, a 5.9 percent decline. That is the largest percentage decline of any metro area in the country and the only payroll change among Indiana metro areas that BLS counts as statistically significant. All of the loss is in state government, a category that includes Indiana University. State government payrolls fell from 18,200 to 12,400, while private employers added about 900 jobs. August is the month university payrolls refill for the fall semester, so the August count varies from year to year (it was 16,200 in August 2024). But state government payrolls in Bloomington have been below the prior year in every month since October 2025.
Lake, Porter and Jasper counties, which BLS reports as a division of the Chicago metro area, had a rate of 4.4 percent, down from 4.6 percent.
What does this mean for the housing market? In Lafayette-West Lafayette, Terre Haute and Michigan City-La Porte, more residents are working than a year ago, which is a positive sign for housing demand. In most metro areas, the low unemployment rate masks a softer job market, with fewer residents working than a year ago. Still, employment is high enough that this softness should not have a large effect on the housing market. More than 95 percent of the labor force has a job in every Indiana metro area. The larger problem for home buyers is interest rates. The average 30-year mortgage rate rose from 6.66 percent in late August to 7.03 percent in the week of Sept. 24, according to Freddie Mac.
The August figures are preliminary. The September metro report comes out Oct. 28.
Sources: U.S. Bureau of Labor Statistics (BLS), Metropolitan Area Employment and Unemployment, August 2026 (preliminary); Local Area Unemployment Statistics; and Current Employment Statistics for states and metro areas. Labor figures are not seasonally adjusted. Mortgage rates are from the Freddie Mac Primary Mortgage Market Survey.