
Mortgage rates drive housing demand: When borrowing costs go up, potential buyers see their budgets shrink or are pushed out of the market altogether. Homeowners with lower rates on their current mortgages have greater incentive to stay put instead of moving on.
2026 has shown once again how difficult it can be to accurately project rate changes. According to the Freddie Mac PMMS, mortgage rates fell briefly below 6% this year and surged as high as 7.4% earlier this month; this swing translates to more than $200 added or saved from the monthly payment on a $275,000 home (our year-to-date median price).
Why rates are up:
Rising inflation in tandem with low unemployment led the Federal Reserve to increase its benchmark rate in September for the first time in three years. On Wednesday, the Fed chose to stand pat…but two members of the Open Market Committee dissented in favor of another increase, and the market is already anticipating a hike in December.
10-Year Treasury yields (which track closely with thirty-year rates) have also hovered around 5% for the past two months, levels that haven’t been seen in twenty years. Investors are demanding higher returns in exchange for uncertainty on inflation, economic volatility and concerns over the ever-expanding national debt.
In short, higher rates are the price of increased risk – circumstances that are unpredictable by definition. Which bring us back to the difficulties of projecting changes in rates.
This is a challenge in planning ahead for REALTORS® and real estate brokerages, and a complication when we go through the annual exercise of forecasting the market for the following year.
We use mortgage rates to build our sales forecasts, because rates and sales move together in the past data. The problem is that a forecast needs future rates, and nobody knows what future rates will be.
We have leaned on expert forecasts from the Mortgage Bankers Association, Fannie Mae, Freddie Mac, and the National Association of REALTORS® as a defensible source for where rates are headed, using the consensus (middle) estimate as an input to our model.
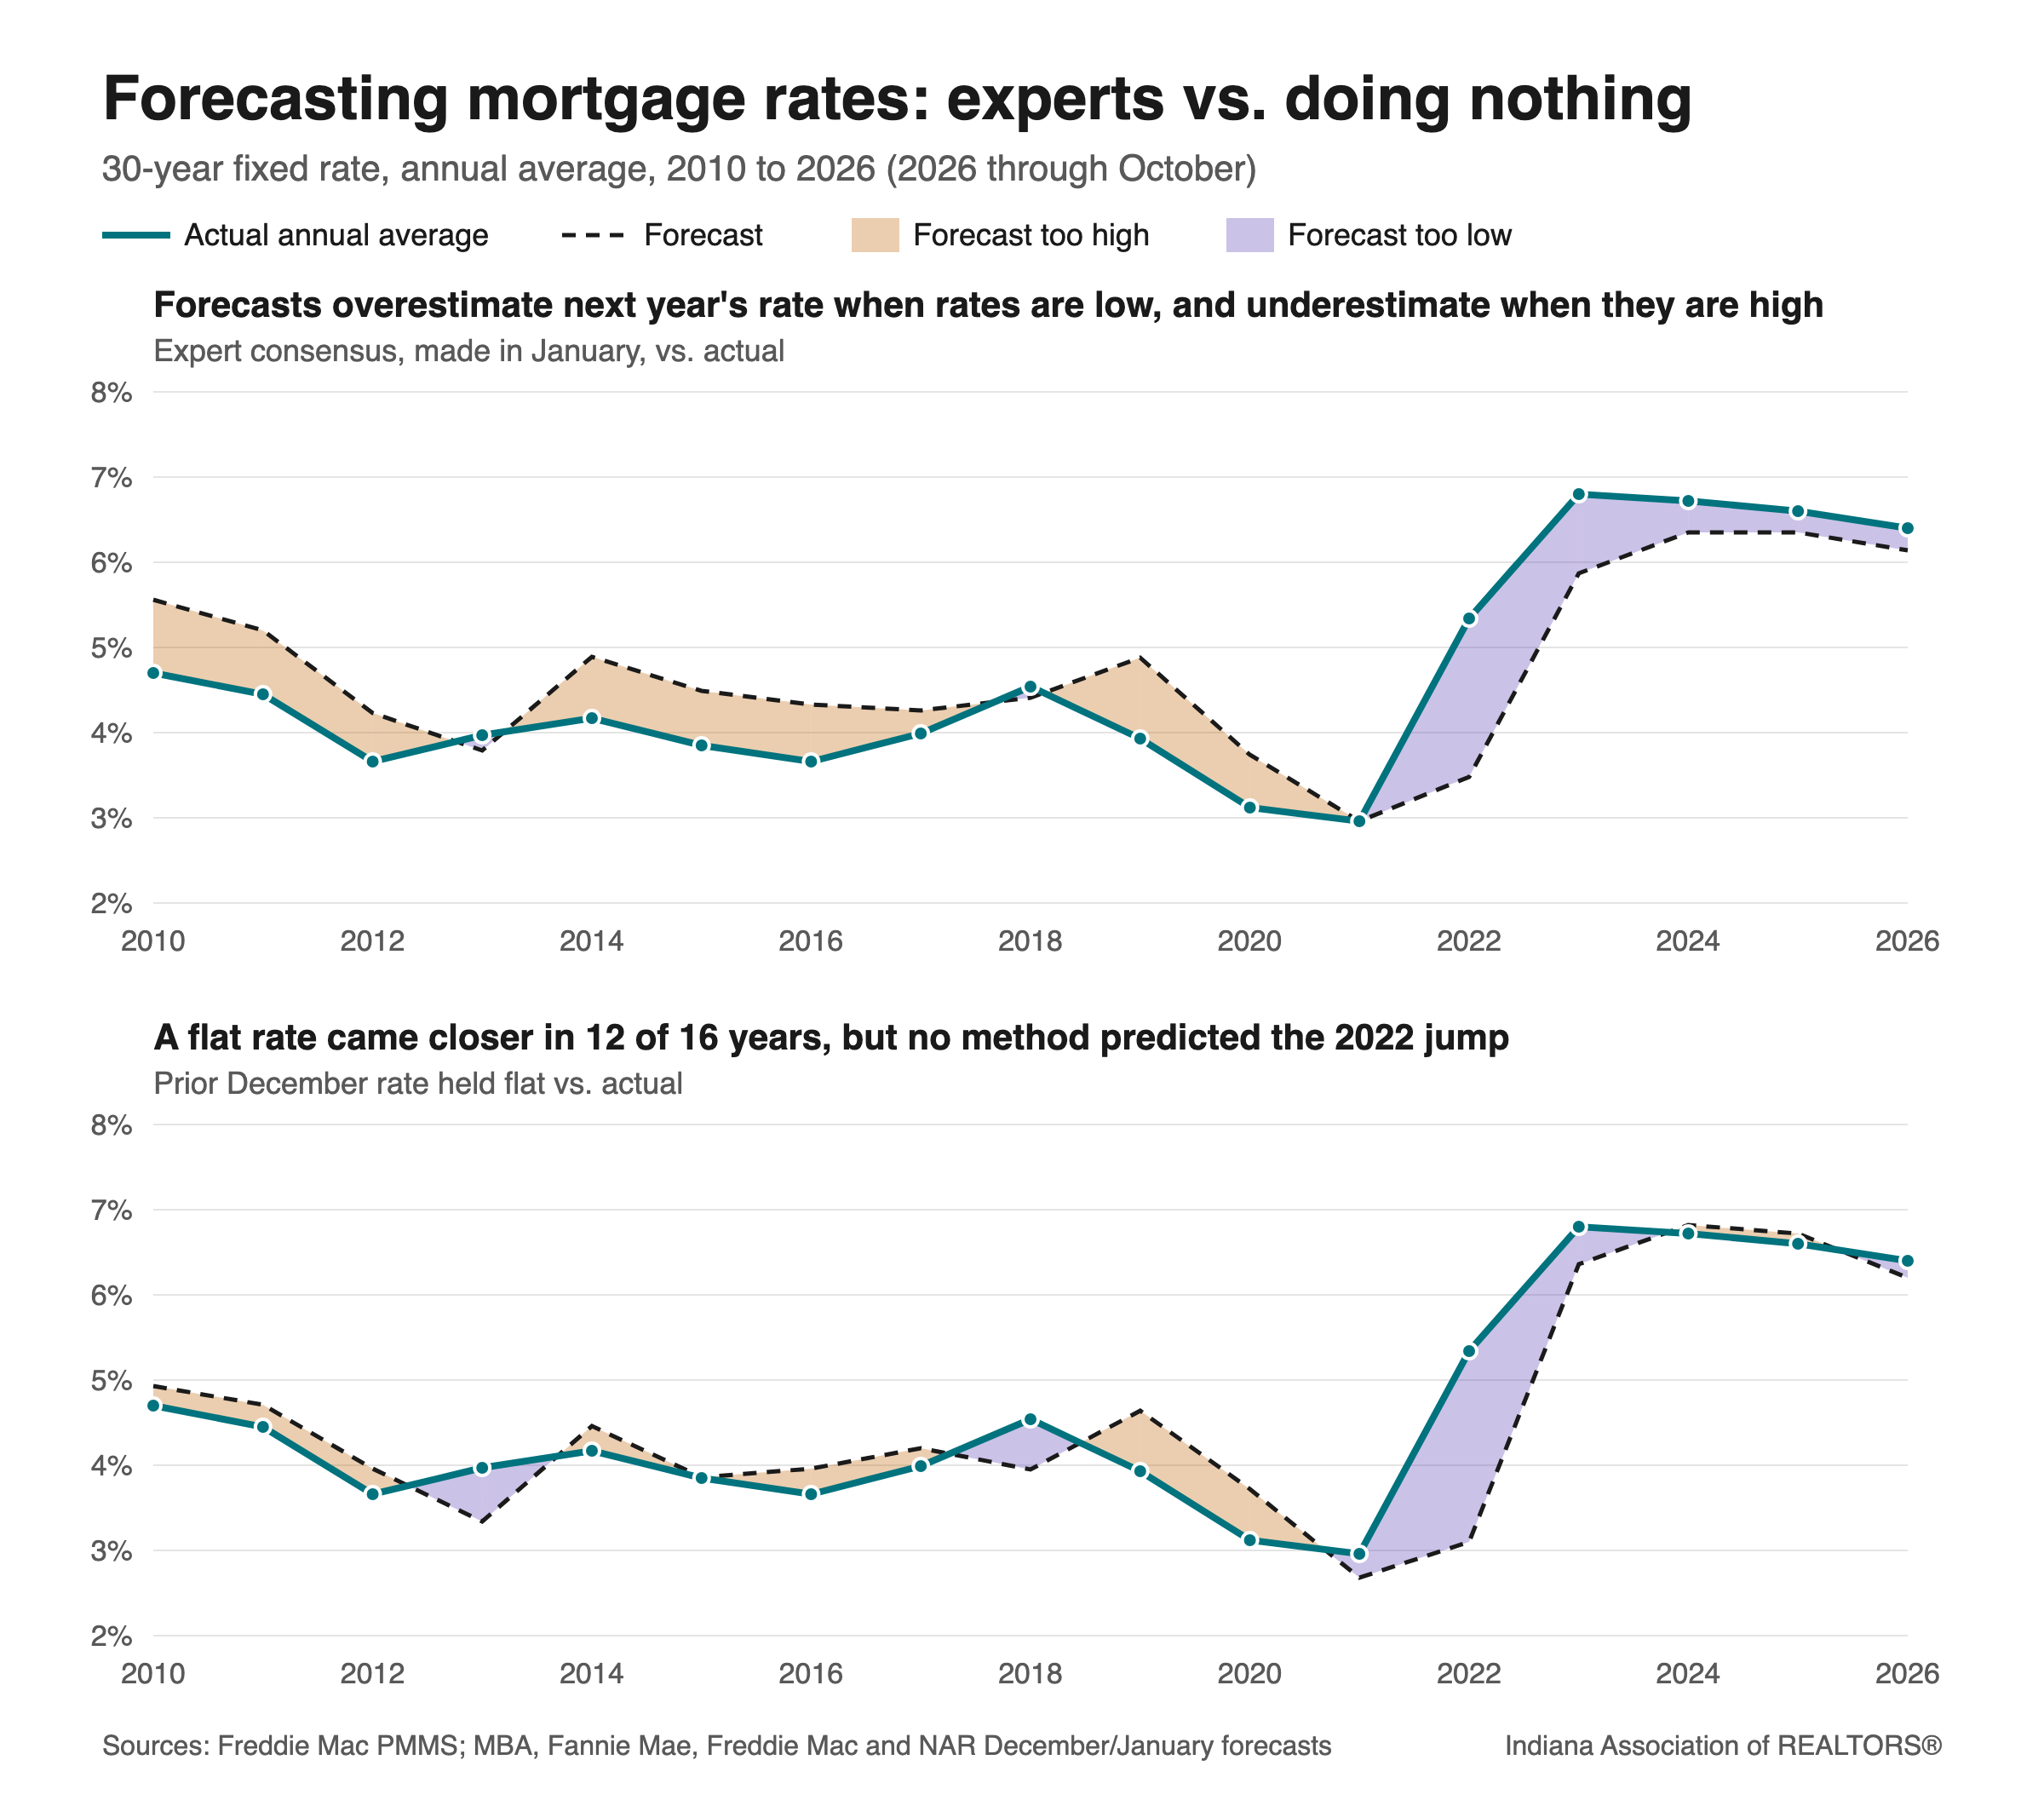
After the consensus missed low for three years in a row, we asked: are these expert forecasts actually better than simply assuming rates stay flat from where they ended December?
They are not. Since 2010, a flat assumption has beaten the consensus forecast three fourths of the time.
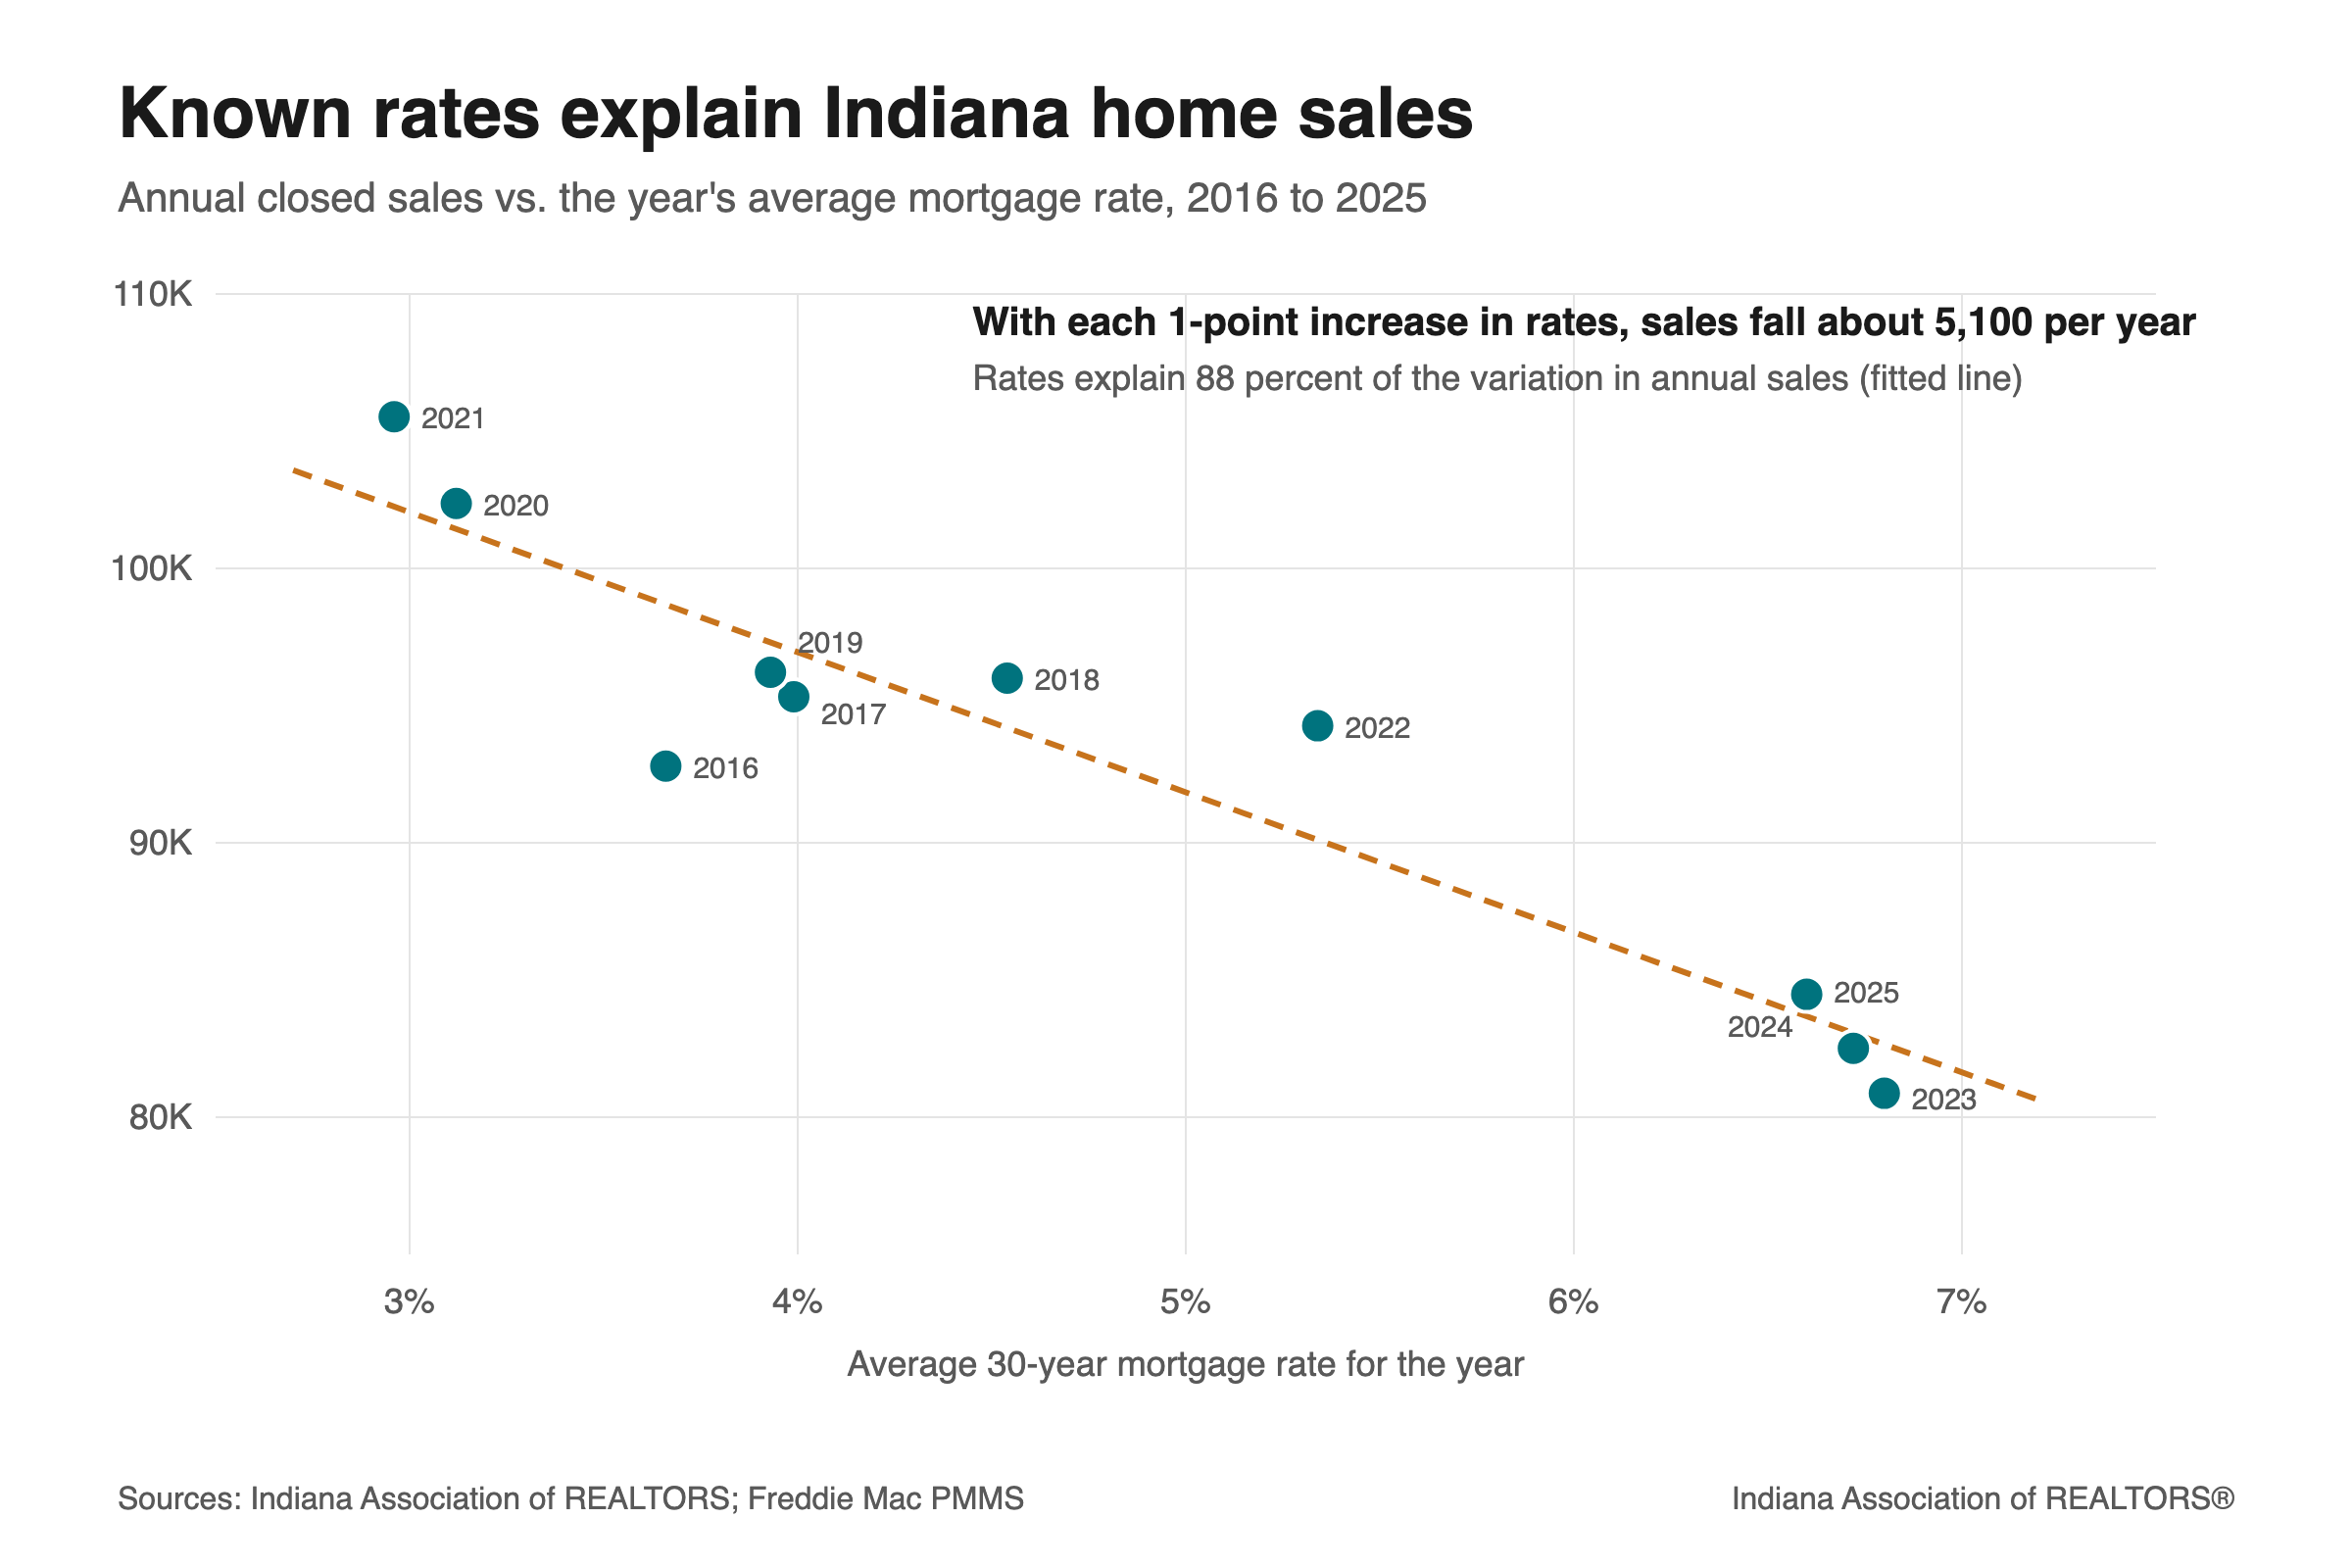
Interest rates are still helpful in our forecasts. From 2016 to 2025, the annual average rate explains 88 percent of the variation in Indiana's annual home sales, and the change in rates from one year to the next explains 75 percent of the change in sales. The catch is that those are known rates, and in January we don't know the rates yet. When we swap actual rates for what the experts expected the rate to be, the explanatory power drops to 34 percent. Put another way, rates are a strong input when you know them and a weak one when you have to guess them, and in January we have to guess.
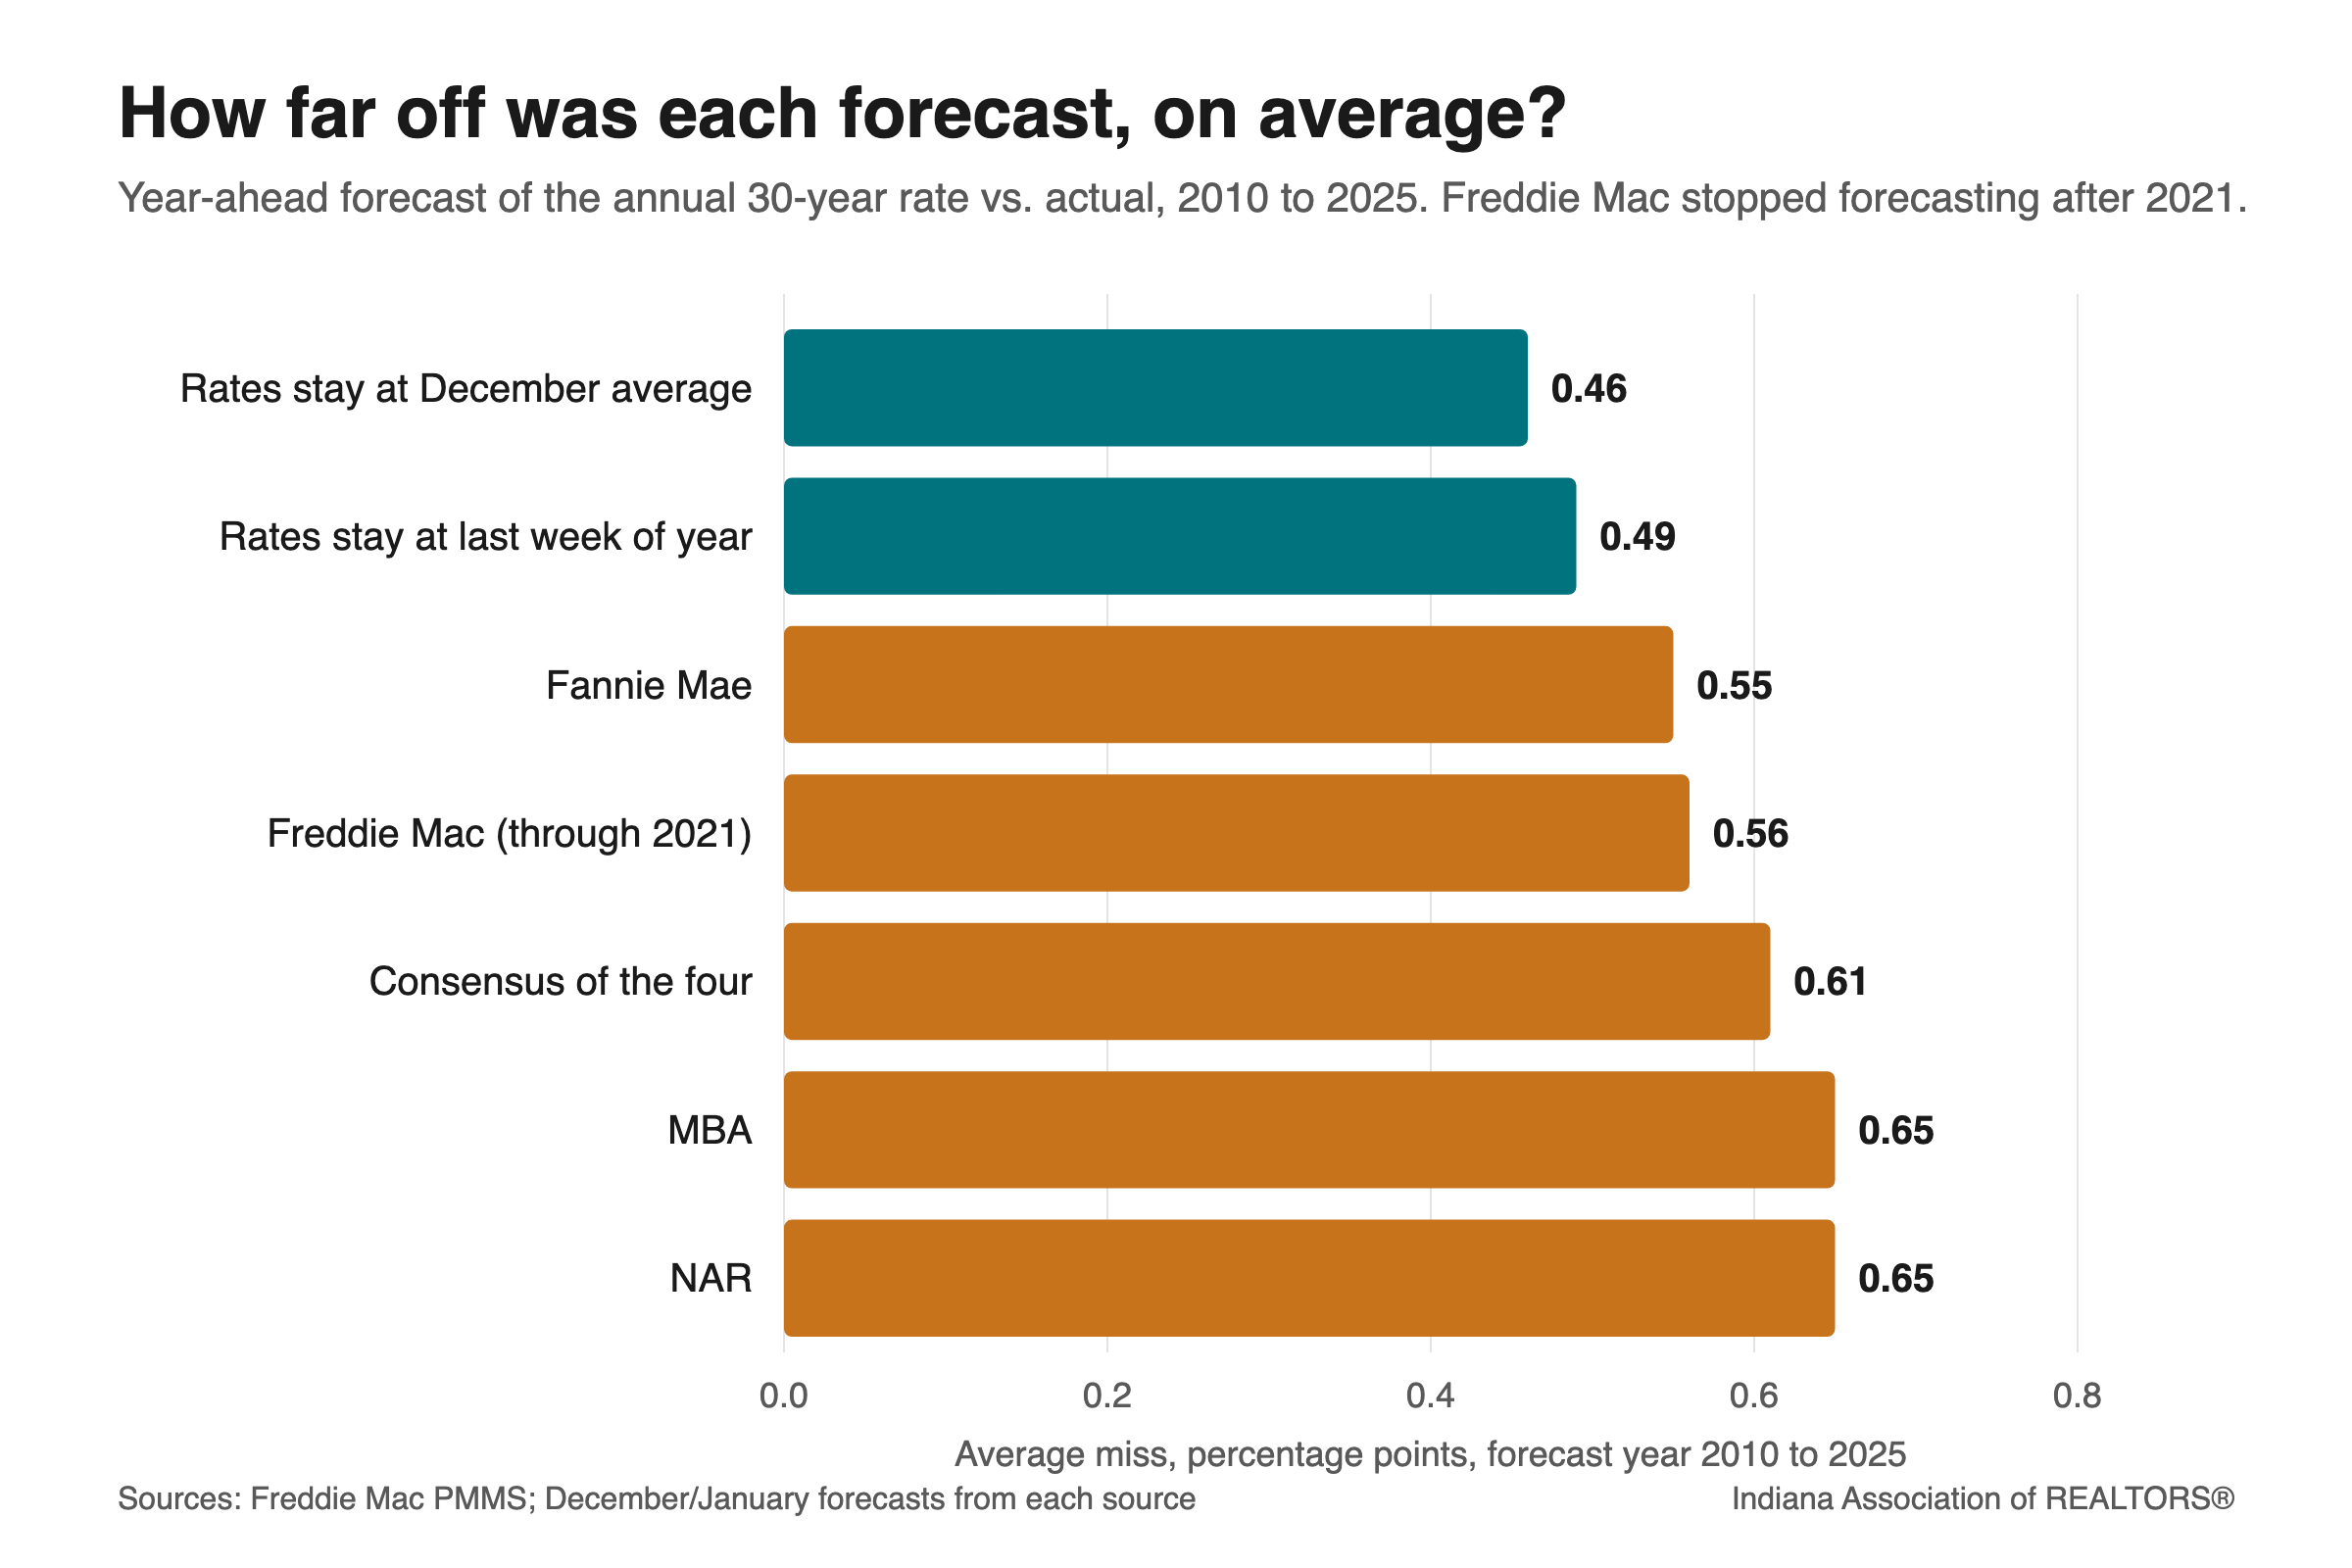
How wrong have the guesses been? We collected the December or January forecast from each source for every year from 2010 to 2025 and compared it with the year's actual average.
Since 2010, the flat method has been 25 percent more accurate than the consensus forecast, missing by 0.46 points on average against 0.61. Setting aside 2022, which both methods missed badly, the flat method is 36 percent more accurate. In the last three years, the years we used the consensus, it is 52 percent more accurate.
The misses also lean one way at a time. From 2010 to 2021 the experts were too high in nine of twelve years, waiting for rates to normalize. Since 2022 they have been too low every year. Fannie Mae has the best record of the group, and it still trails the flat assumption.
This matters for our forecasts because the rate assumption has been the largest piece of our sales miss in two of the last three years. For 2027 we will keep rates in the model, but the core projection will assume rates stay near where they end this year. The expert paths will appear as scenarios, which is where a forecast with a 0.6 point average miss belongs.