Use the map tool to find ZIP Codes where market activity is heating up
Select a map of listings by ZIP Code. Use the last 3 months or 12 months to stabilize noise and look for meaningful trends.
Set the indicator to year-over-year so we are viewing growth in listings rather than a count of listings. Filter out ZIP Codes with less than 10 sales. These small areas can have huge year-over-year change with very few listings.
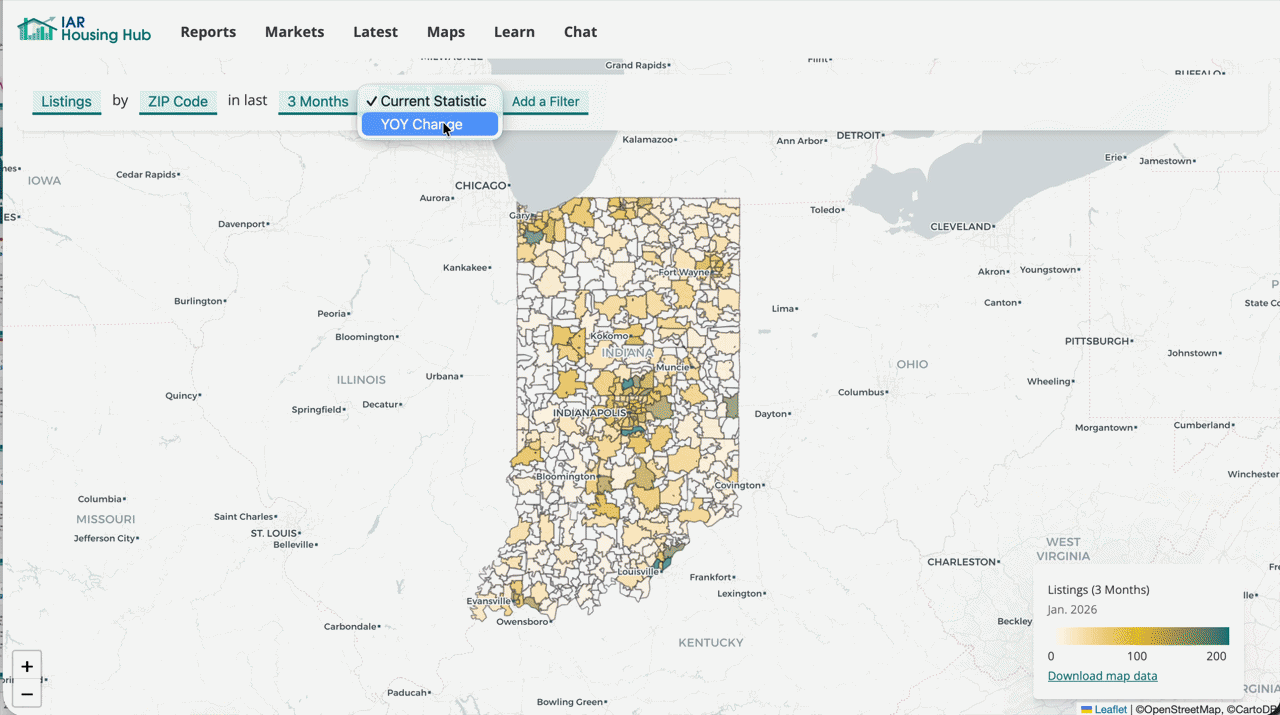
Maps are most useful when they help you narrow focus. Filtering out noise makes real patterns easier to spot.
This turns the map into a decision tool, not just a visualization.
Always click into a ZIP to confirm the trend before acting on it.