Encourage Buyers About Market Conditions
1 Min.
Read
•
Brokers
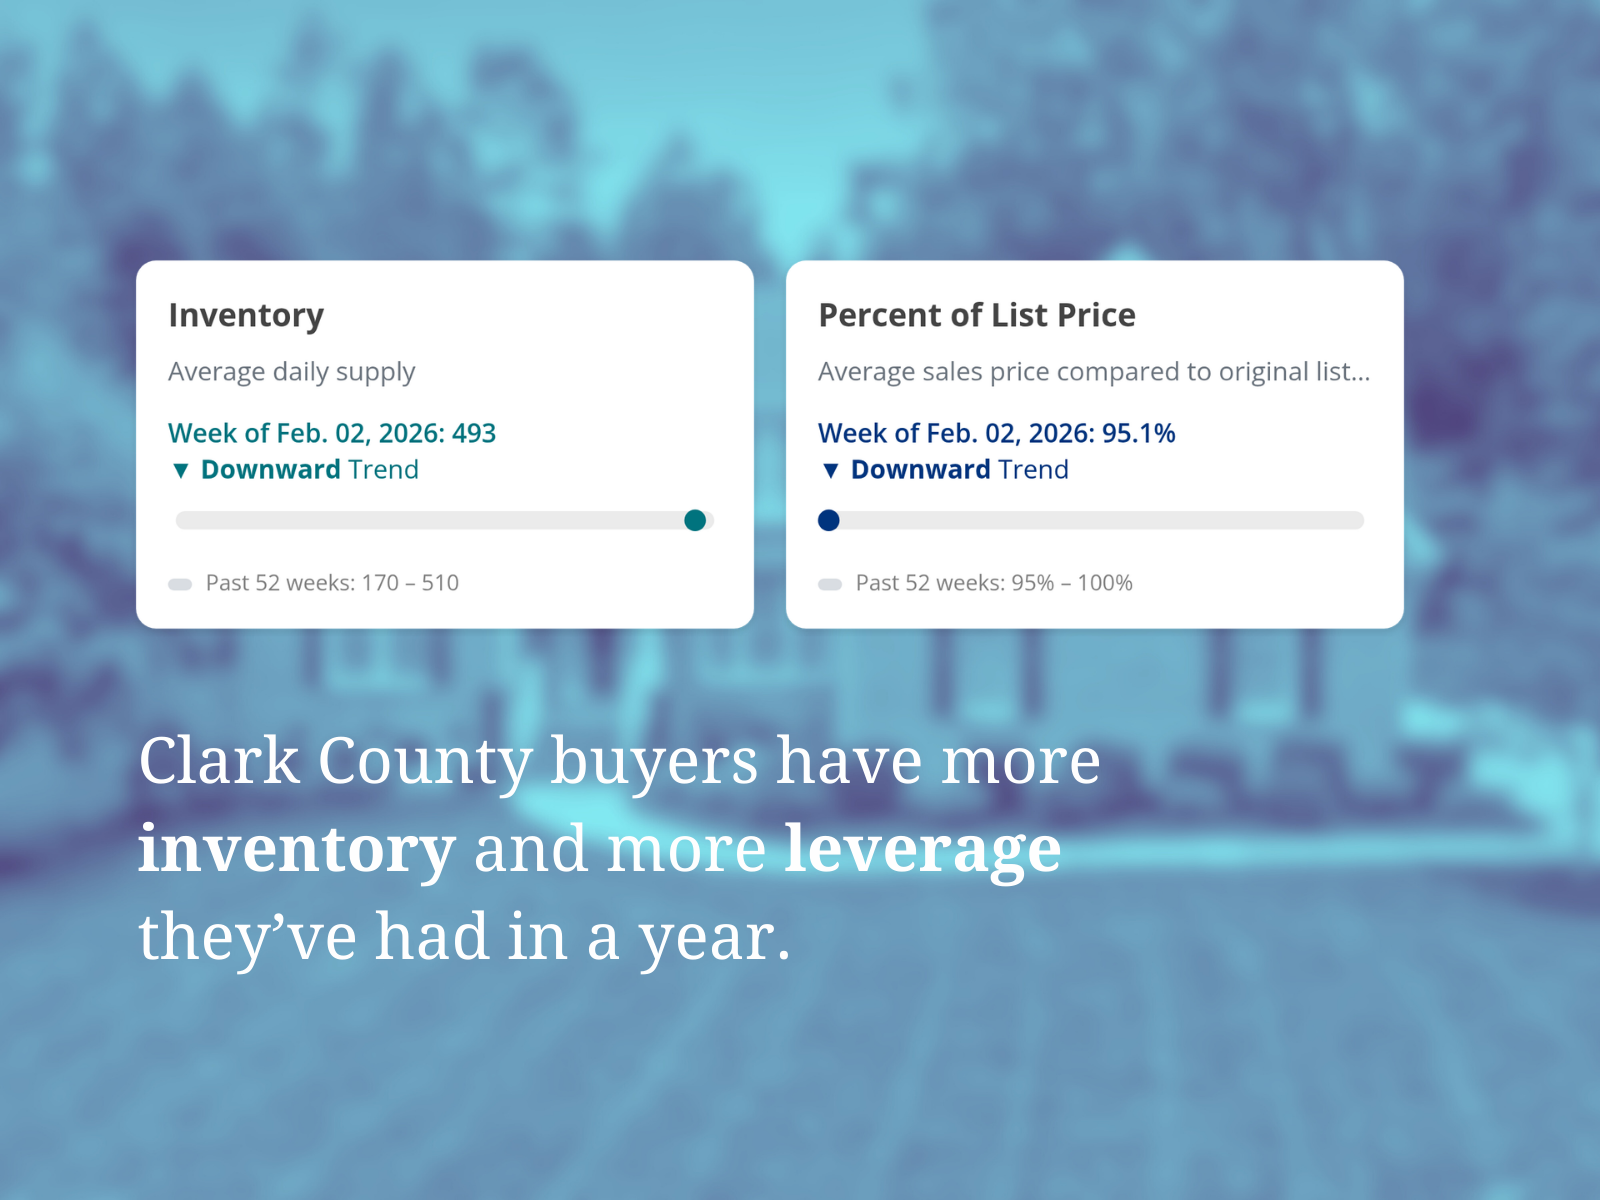
Use range plots to see how a current metric compares to the past year
How we made it
- Choose metrics that signal leverage: Inventory and Percent of List Price.
- Use the Range plot widget to show where today sits within the past year.
- Let the position of the dot do the work—no chart reading required.
- Blur the background and apply a duo-tone filter to make the cards standout.
- Add a short headline that translates the signal into plain language for buyers.