Create Slides for Listing Presentation
5 Min.
Read
•
Brokers
Set expectations with 2-3 data-driven slides about a ZIP Code
Preview
Pull Long-Term Report and Export Charts
We'll focus on the ZIP Code where the listing is located. Export the Median Sale Price chart and the Days on Market chart.
Preview: Pull Long-Term Report → export charts
Generate talking points for slides
Have Spark draft talking points for the slides you downloaded.
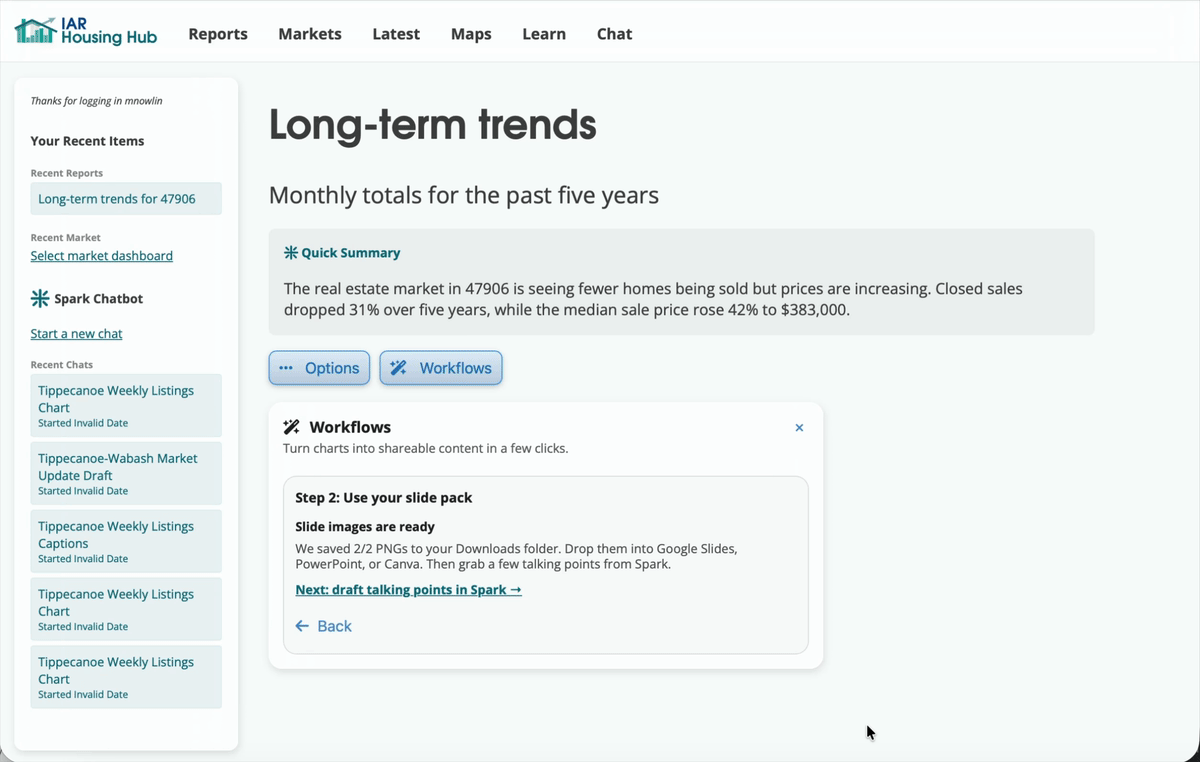
Preview: Pull Long-Term Report → export charts
Drop into slides
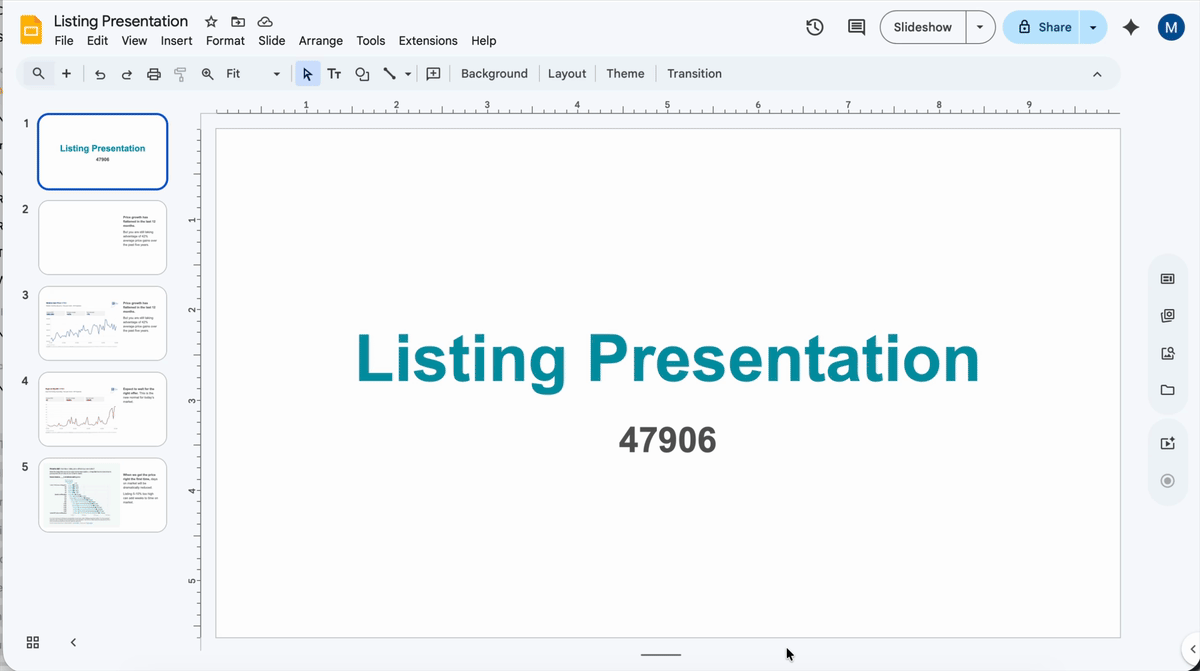
Preview: Add to slides
How to do it
When to use this
- Sellers anchored to last year’s prices
- Price reduction conversations
- Competitive listing environments
Steps
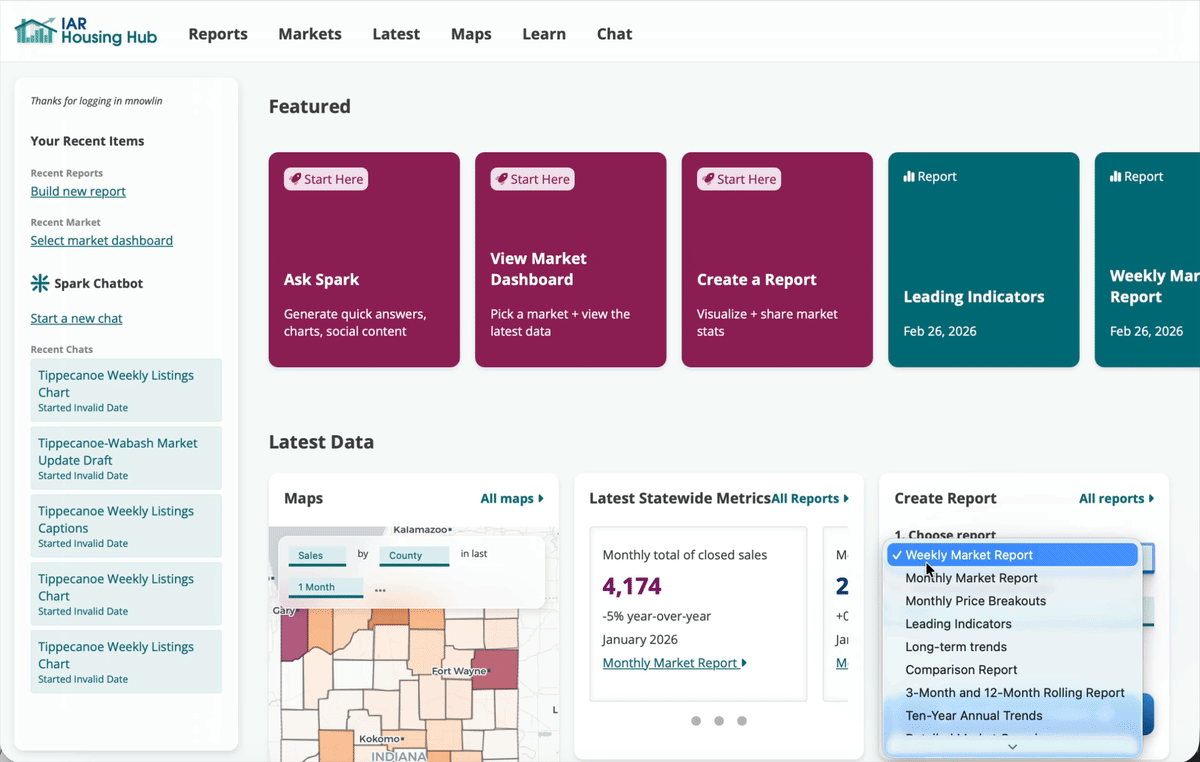
- Pull a Long-Term Report for your ZIP Code.
- Use the Workflows menu to export charts and draft talking points.
- Drop those into slide deck software like Powerpoint or Google Slides.
Why this works
Long-term trends shift the conversation away from emotion and toward context.
Sellers are more receptive when they see how today fits into a larger pattern.
The charts do the explaining for you.
Pro tip
Keep this to two or three slides. More than that and the message gets diluted.
Build these slides →