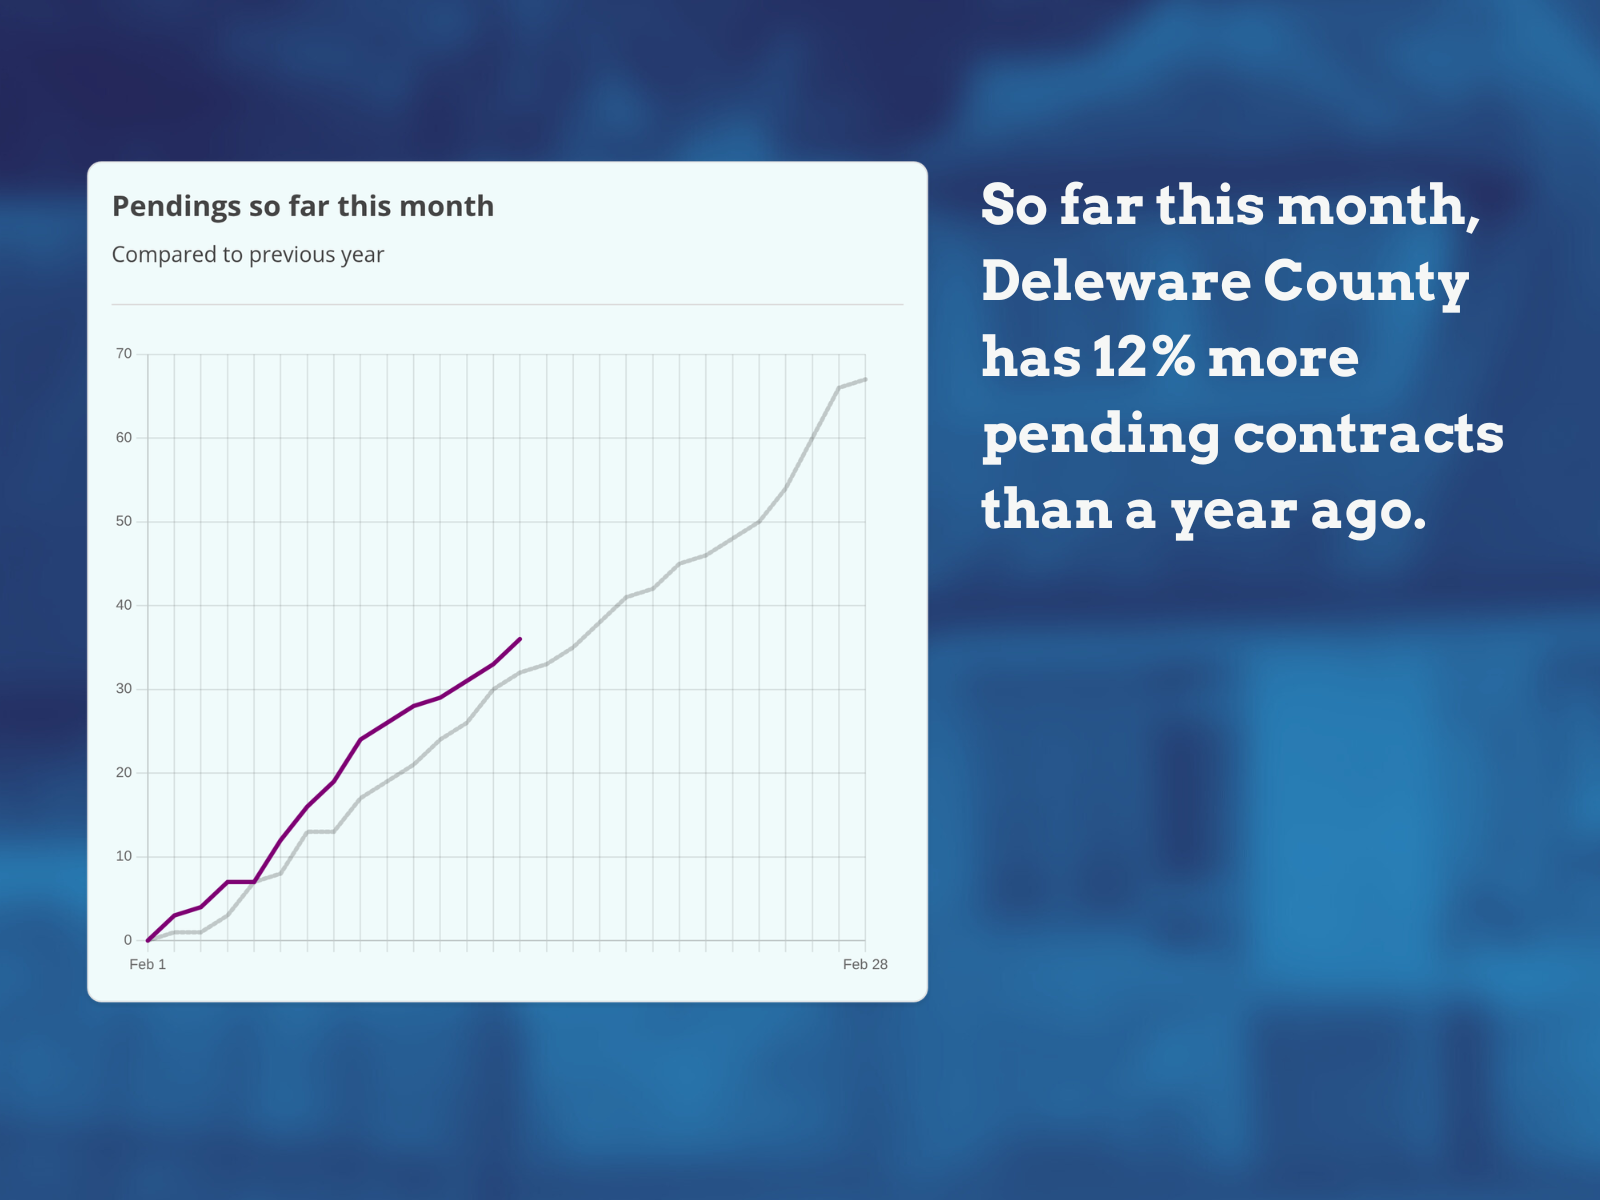
Daily Pendings Snapshot
1 Min.
Read
•
Brokers
A clean “as-of today” indicator that shows where demand is tracking versus last year, with a simple takeaway headline.
How we made it
- Metric: Daily pendings (month-to-date), compared to the same days last year.
- Widget: Full chart with a small title block so the headline on the right stays dominant.
- Design: Use a branded background color and keep the chart on a light card for contrast and readability.
- Copy: Pull one clear stat (e.g., +12% YoY) and write it as a single sentence takeaway.
- Tip: If the month isn’t complete, say “so far this month” (or “as of Feb 18”) to keep it honest and scannable.
When to use this
- Mid-month check-ins (“How are we tracking right now?”)
- Fast-moving markets where weekly updates feel too slow
- Social posts where one line + one chart is the right amount