 Reports
Markets
Latest
Maps
Learn
Spark
Reports
Markets
Latest
Maps
Learn
Spark
Draw a hyperlocal market from map cells and get an instant snapshot.
Type a ZIP, county, or neighborhood name and pick a result. The map flies straight to it, shaded by how active each block is.
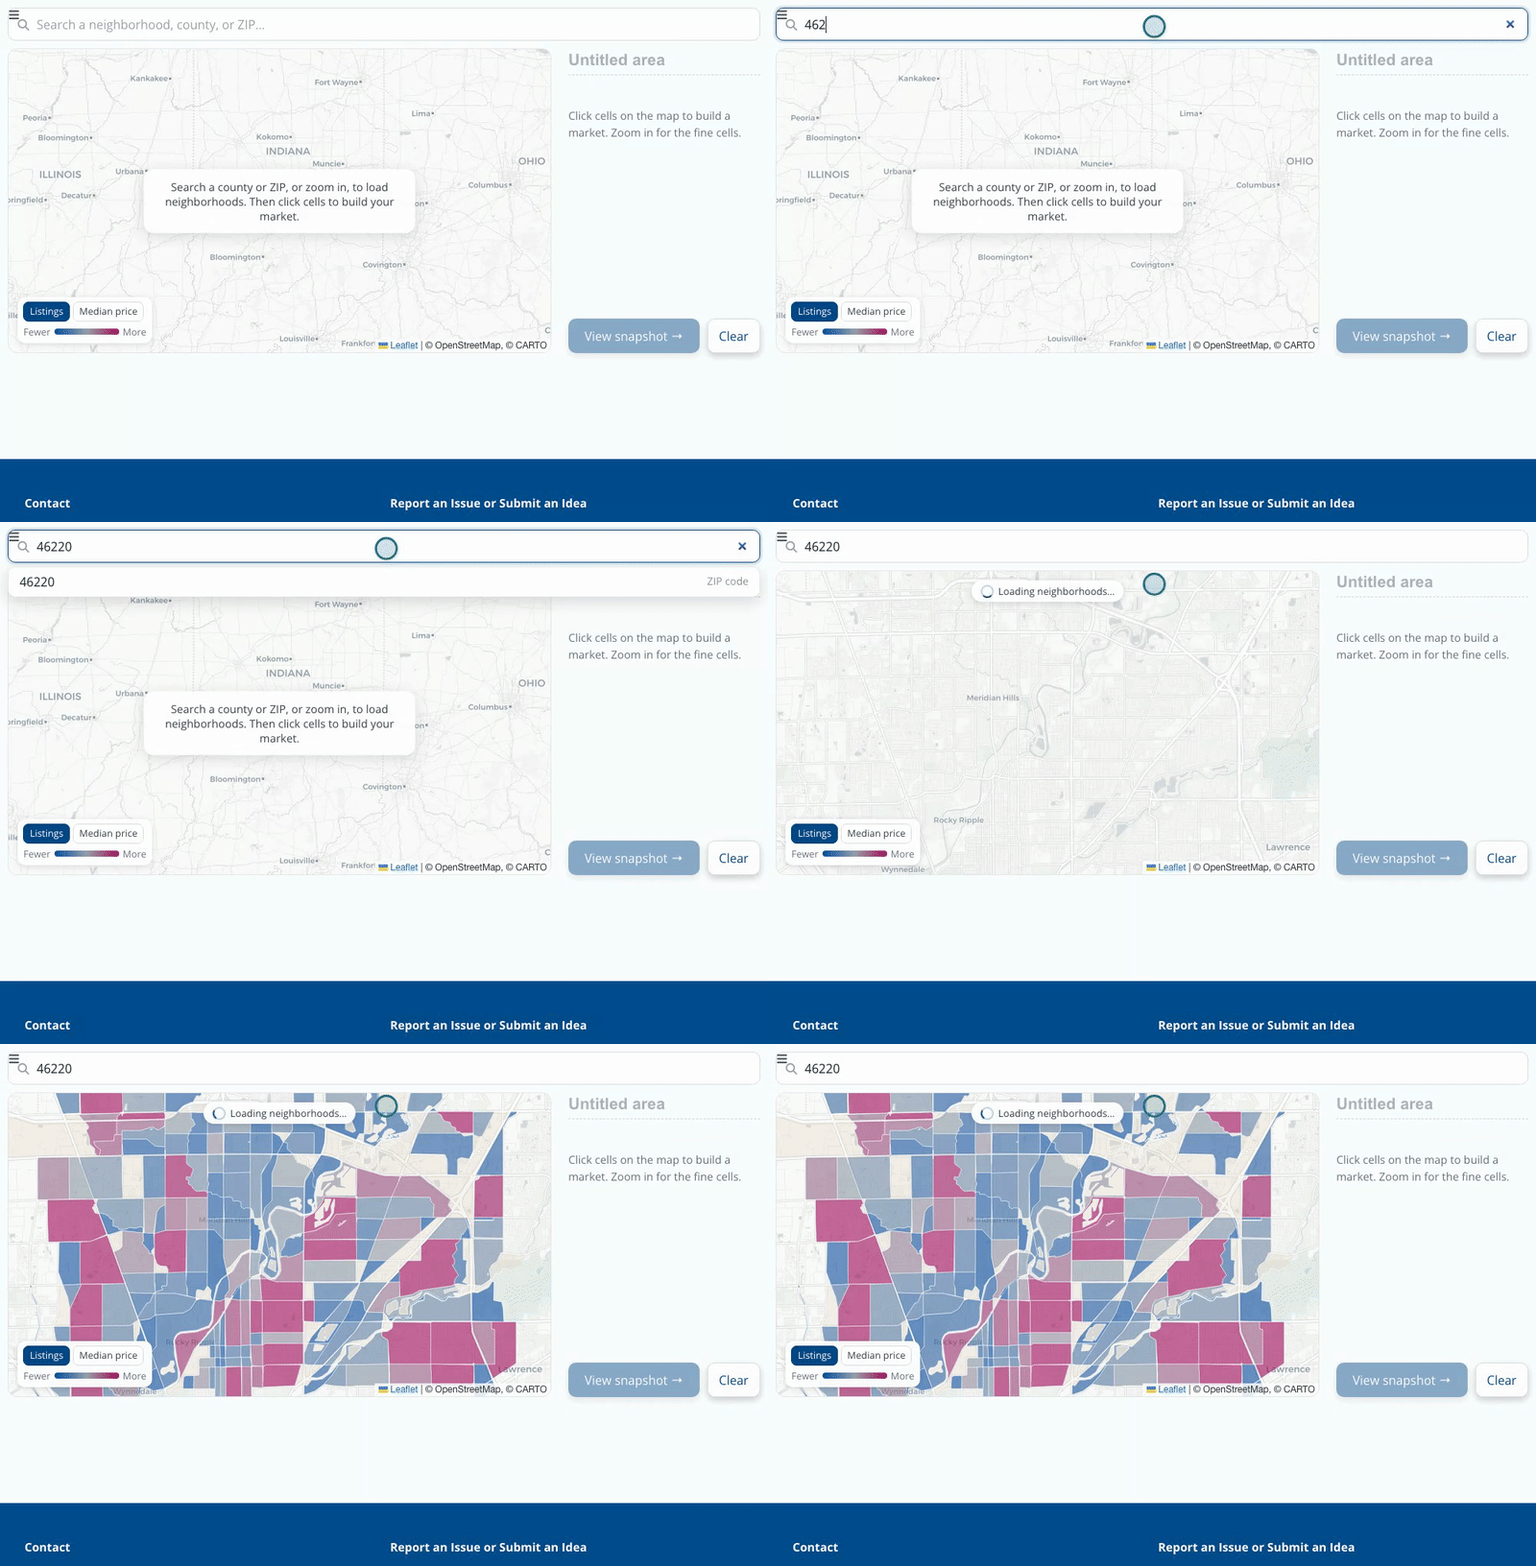
Search a ZIP, county, or neighborhood to jump to your patch of the map.
Each colored cell is a slice of the map. Click the ones that make up your neighborhood and the panel tallies homes listed, homes sold, and median price as you go. Zoom in for finer cells.
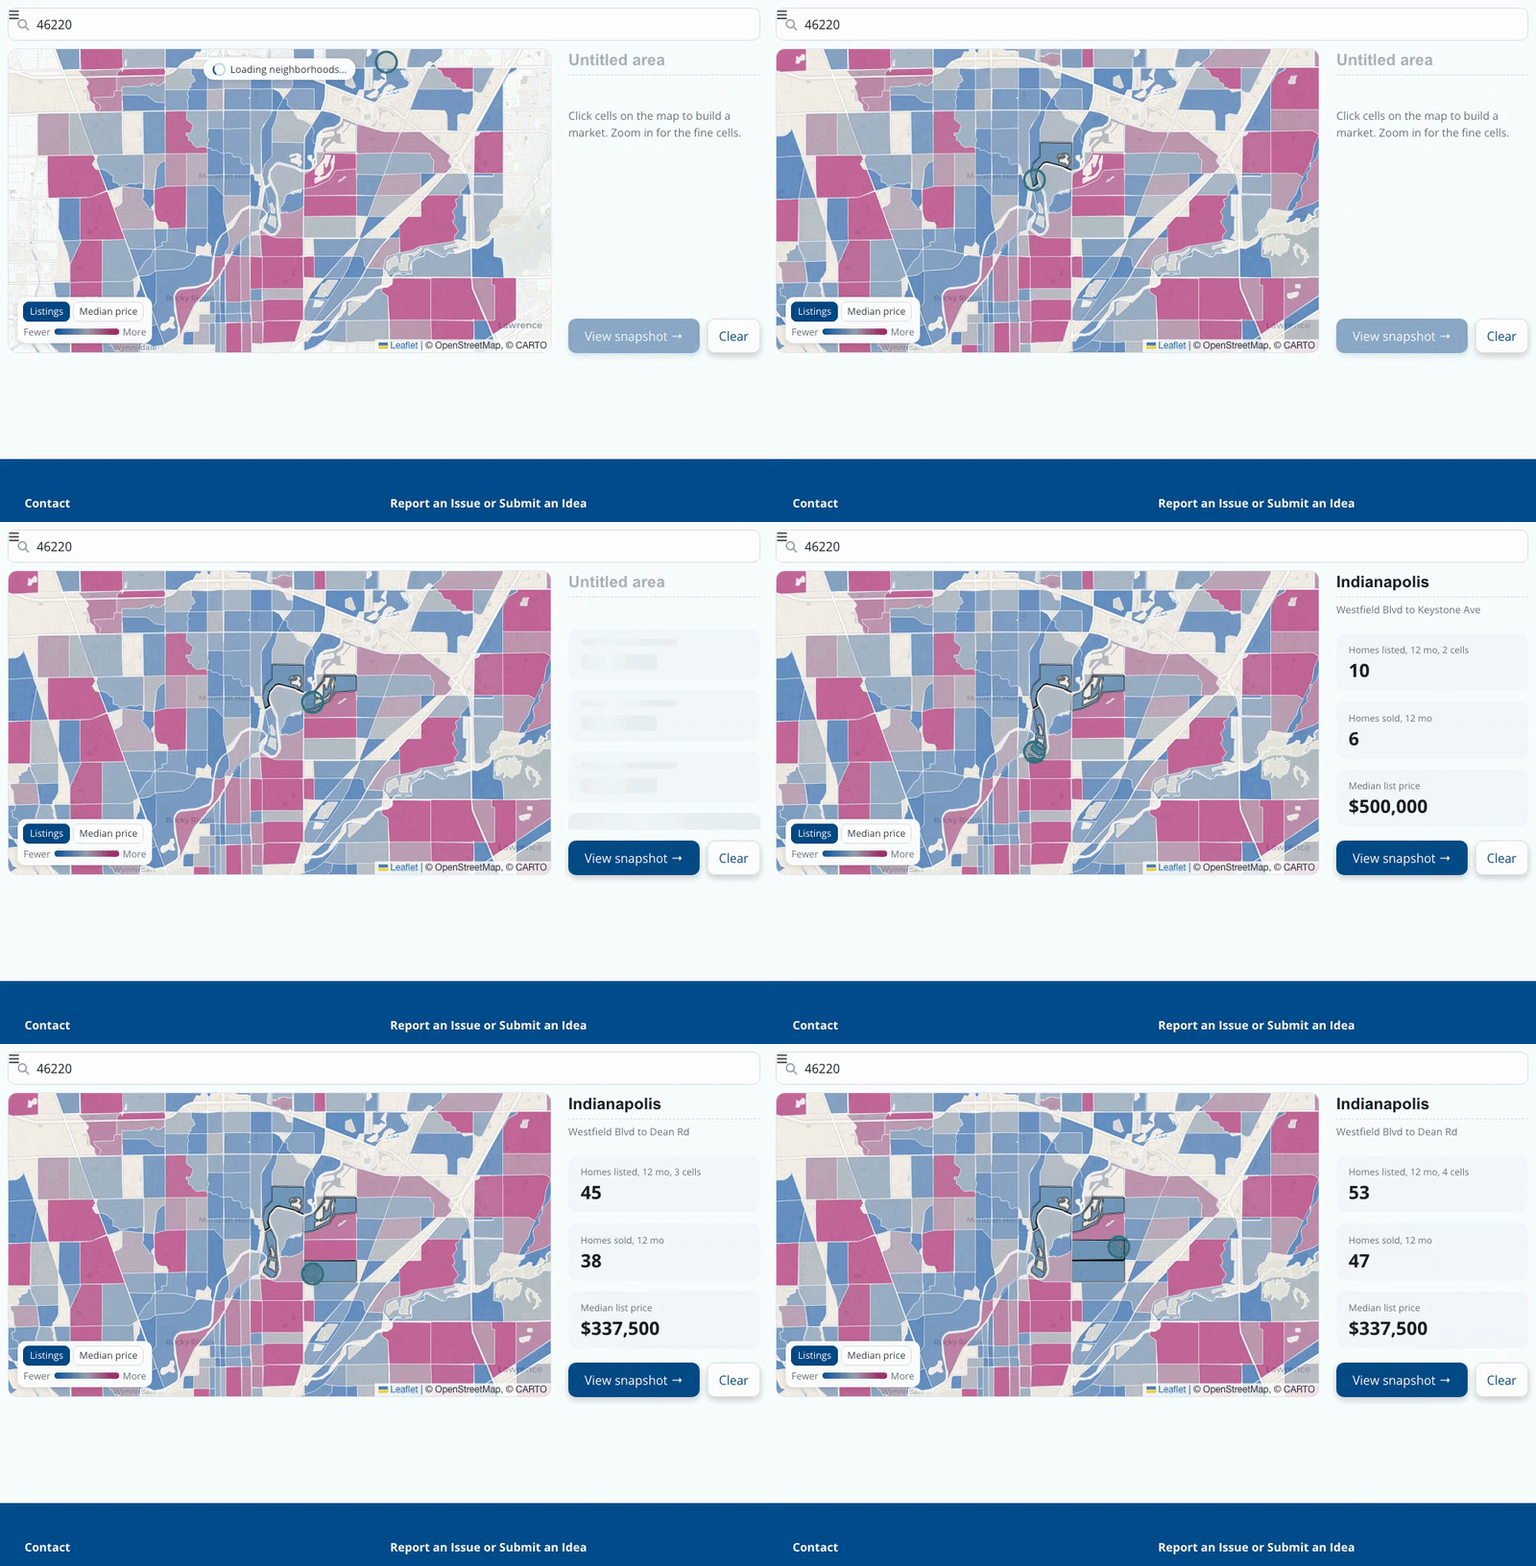
Click cells to assemble a hyperlocal market. The stats update as you build.
When the area looks right, open the snapshot for the full read: a market-heat score, days on market, sale-to-list, and the best months to buy or sell. Hit print to export this as a PDF.
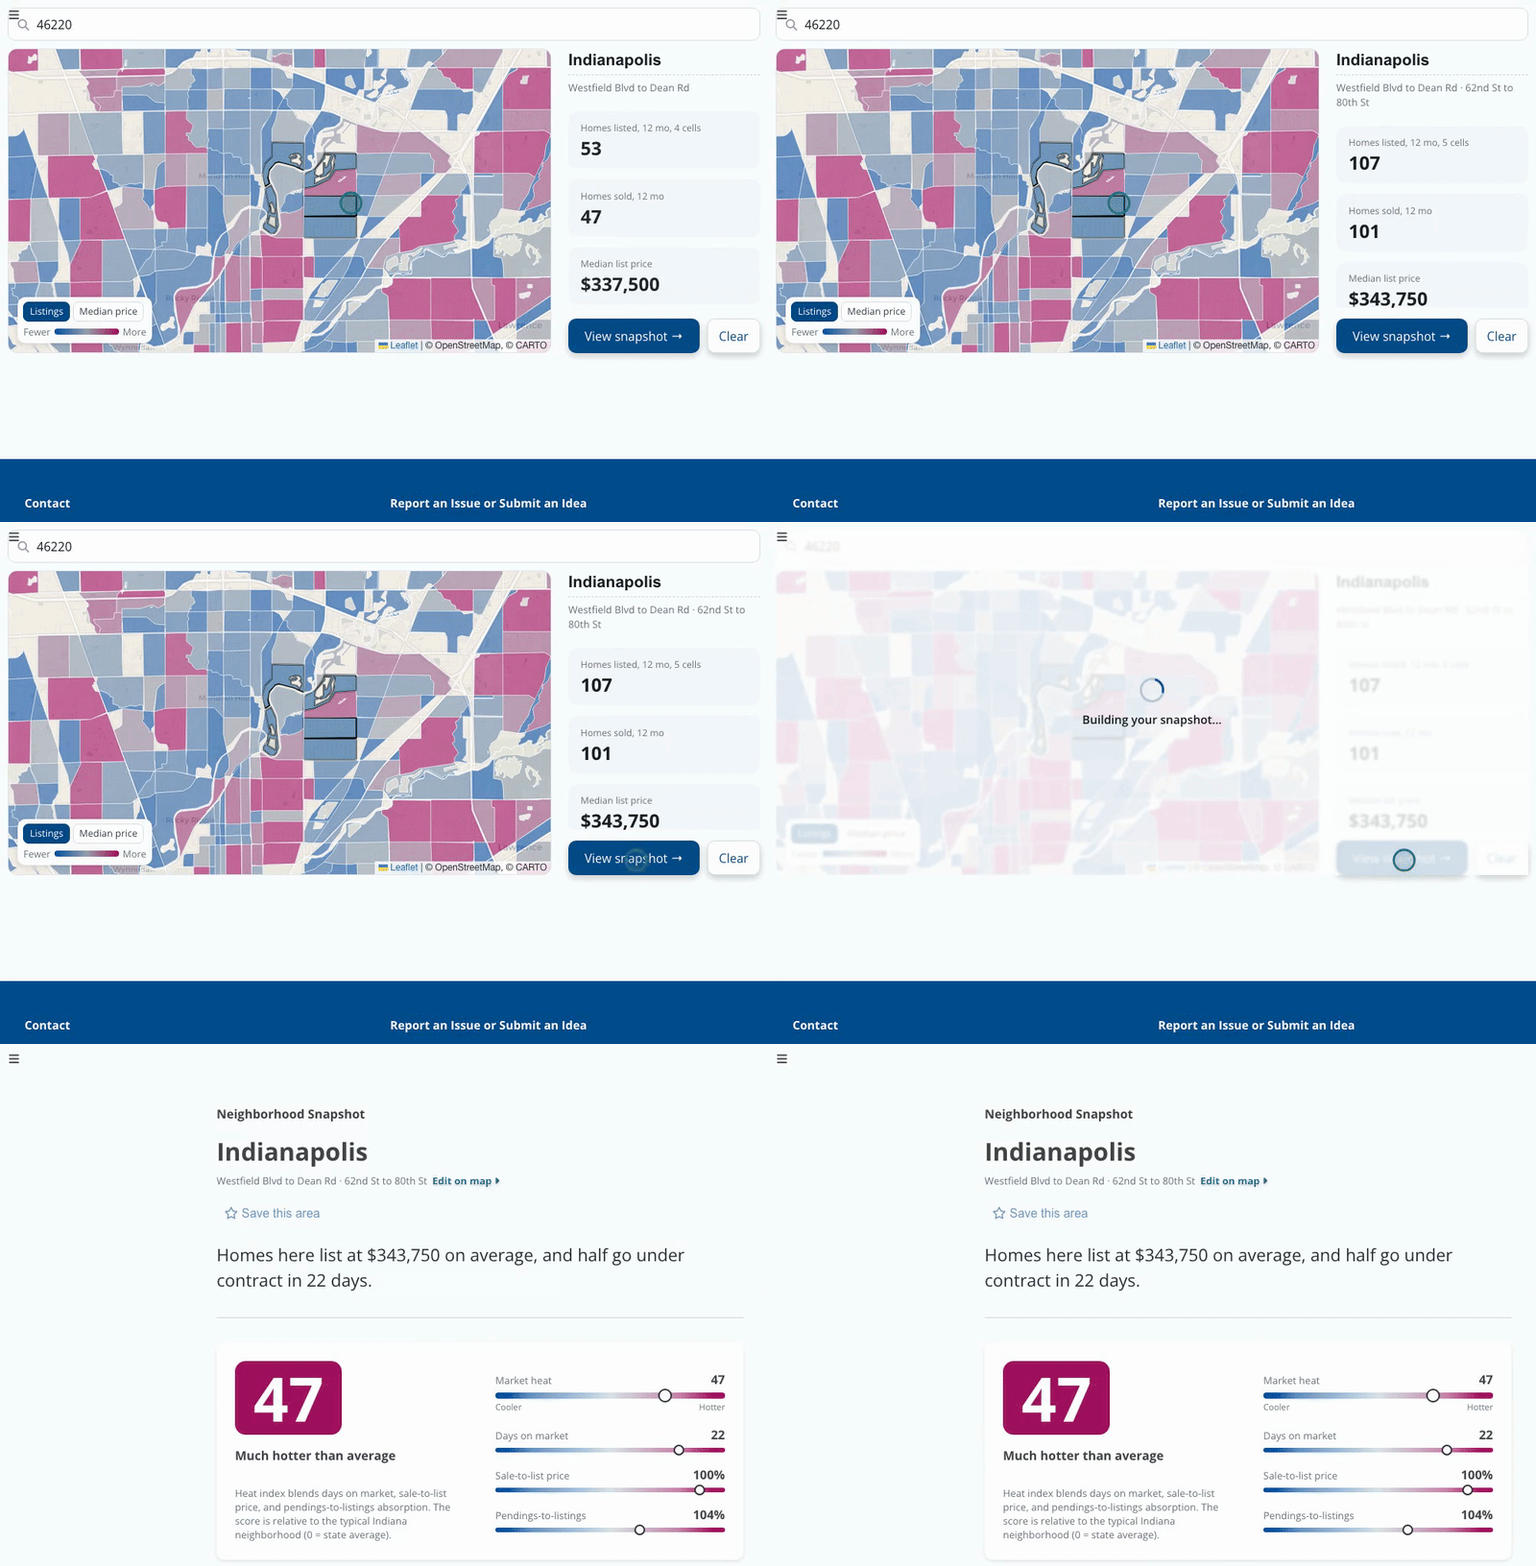
One click turns your cells into a full hyperlocal snapshot.
Counties and ZIPs rarely match the area you actually work. Building from cells lets you draw the exact patch that matters, a subdivision, a school zone, one side of a highway, and get numbers that speak to it. That specificity is what makes a client feel like you know their street, not just their city.
We note if you have a big enough sample size before you build your snapshot. If you choose an area with plenty of listings for reliable trends, we show a green note. If you see an orange note, we have to pool several months of data to build trends. Consider adding another few blocks to your neighborhood to capture more sales and listings.